
It's the time of year that investors typically dread: capital gain distribution season! This period brings the not-so-pleasant anticipation of how hefty THIS year's tax bill may become. At the end of every year, both mutual funds and exchange traded funds need to calculate their net realized capital gains (both short term and long term, since two different tax rates apply). The capital gains are realized from trades made throughout the year, driven by both the active investment decisions you made as an advisor, forced trading events, and flows into and out of the funds. The distribution is typically made during the month of December and appears as a "dividend."
This may be confusing to some investors as this distribution isn't a real dividend but a form of "return of capital." These are the distributions that may generate surprise tax bills for many investors. This is not a fun surprise like a surprise birthday party, rather it's an unpleasant surprise since it may mean a higher tax bill than expected.
This year though, the surprise won't just come from capital gain distributions. With cash holdings in the U.S. at a record high, a lot of investors may be surprised to see a larger tax bill due to the interest income they have received. Interest is being paid out from bond funds at a much higher rate than just two years ago. While this is good for those who are invested in tax-free municipal bond funds in their non-qualified accounts, for those investors in taxable bond funds, money market funds, or Certificates of Deposit (CDs), it will most likely result in a sizable increase in taxes paid.
Capital Gains – Zooming in on U.S. Equities
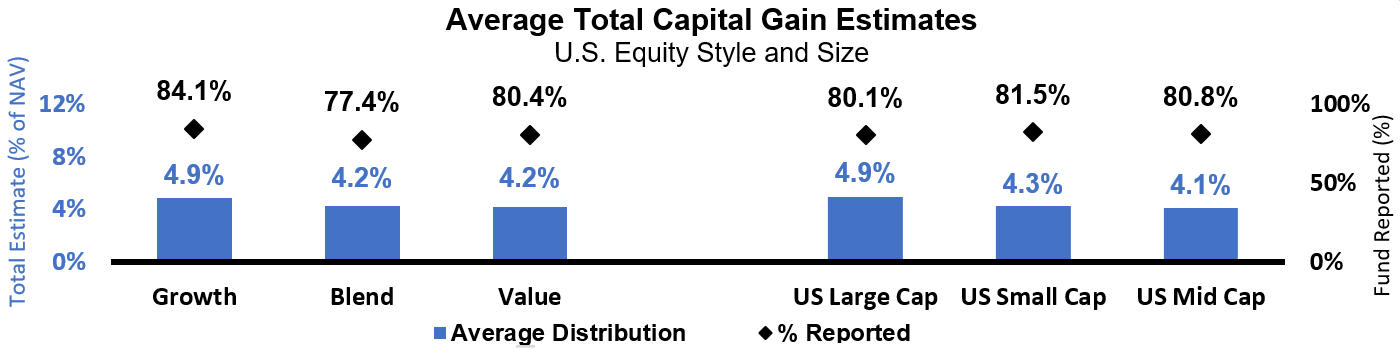
With more than 75% of U.S. equity funds having released their 2023 estimates on capital gain distributions, we have enough information to make an assessment on this year's environment.
First, among styles, the estimated distribution range is between 4%-5% of Net Asset Value (NAV). While there is less variability compared to previous years, growth is leading the way while value is coming in at the lower end of the range. When it comes to the different parts of the market capitalization spectrum, U.S. large cap again is expected to be at the upper part of the 4% to 5% capital gain distribution range while small cap is expected to be at the lower end of the range.
(Click image to enlarge)
Source: Russell Investments and Morningstar Direct, as of 11/27/2023. Categories based on Morningstar Category Group which includes mutual funds and ETFs (and multiple share classes). The average capital gain distribution % is calculated using the total capital gain distribution and respective pre distribution NAV as reported by Morningstar. % of NAV is calculated as (total capital gain distributions ÷ respective pre distribution NAV).
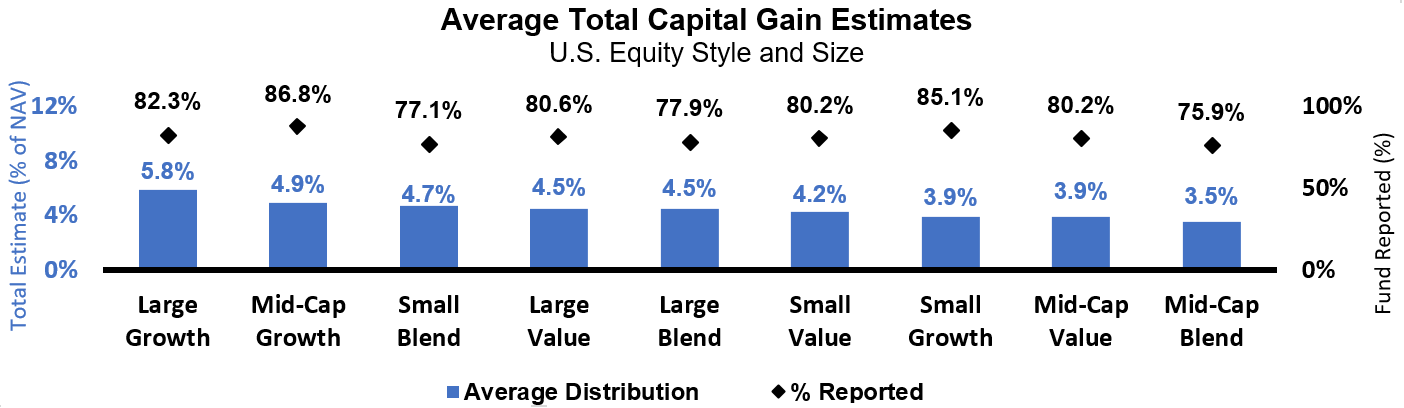
Delving further, funds within the U.S. large cap equity category are expected to distribute capital gains within a range of 4.5% to 6.0% of NAV. Large cap growth funds are poised to be at the higher end of this spectrum; while large cap value funds are expected to fall towards the lower end of this range.
Among a broad category of mid cap and small cap funds, the expected range of capital gain distributions is 3.5% to 5.0% of NAV. This broad category is a bit of a mixed bag. mid cap growth is expected to come in at the upper part of that distribution range, while mid cap blend and value are expected to be at the lower end. In the middle part of the range sit the small cap categories. Small cap growth and value are expected to distribute about 4%/NAV while small blend funds will likely come in just under mid cap growth.
Capital Gains – Looking at the broad categories
(Click image to enlarge)
Source: Russell Investments and Morningstar Direct, as of 11/27/2023. Categories based on Morningstar Category Group which includes mutual funds and ETFs (and multiple share classes). The average capital gain distribution % is calculated using the total capital gain distribution and respective pre distribution NAV as reported by Morningstar. % of NAV is calculated as (total capital gain distributions ÷ respective pre distribution NAV).
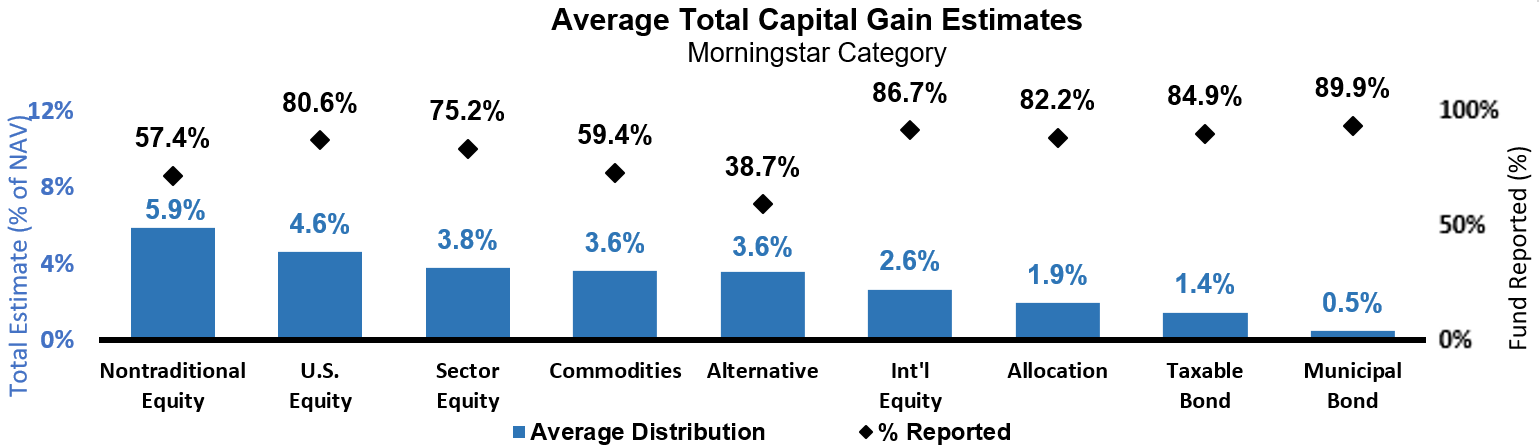
Taking a look at distributions across all asset classes, the fixed income categories capture our attention. Distributions are expected to be relatively small. But the question that needs to be asked is – why are fixed income funds distributing at all? After a "once in three generations" spiral of dramatic interest rate hikes in 2022, sizable capital losses were built up in fixed income assets, broadly speaking. The fact that a 1.5% distribution is expected in taxable bond funds and a 0.5% distribution in tax-exempt municipal bond funds is a tad surprising and a bit disappointing.
Beyond fixed income, international equity funds are expected to deliver relatively small capital gains distributions. Commodity and sector-based funds are expected to post distributions in the middle part of the overall range. Certain sector fund categories such as technology, real estate and financial services are expected to have higher overall distributions than the sector equity category average while infrastructure and defensive sectors are expected to be at the lower end of their respective range. At the upper end of the range is the non-traditional fund category: this includes funds focused on derivatives and long-short strategies. By their nature, these investment strategies tend to not be overly tax-efficient so their standing at the upper end of the range is not necessarily an outlier.
(Click image to enlarge)
Source: Russell Investments and Morningstar Direct, as of 11/27/2023. Categories based on Morningstar Category Group which includes mutual funds and ETFs (and multiple share classes). The average capital gain distribution % is calculated using the total capital gain distribution and respective pre distribution NAV as reported by Morningstar. % of NAV is calculated as (total capital gain distributions ÷ respective pre distribution NAV).
Let's not forget interest income
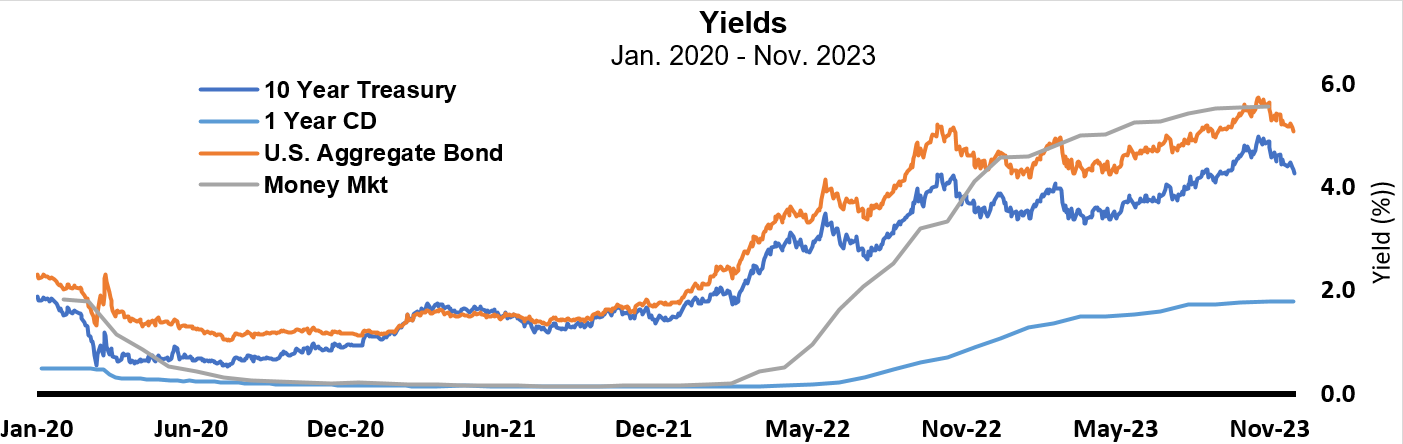
Interest has not been a story when it comes to sizable tax impacts for a number of years. Low interest rates equal low tax bills because there was little interest income. That has now changed with the U.S. Federal Reserve embarking on a sizable interest rate hiking campaign in 2022. Many taxable bond funds have coupon yields now of 5.5% or greater; many money market funds and CDs are offering 4% to 5% interest rates. This is substantially higher than in years past. Since this interest income is taxed as ordinary income, which commands a larger rate than capital gains, investors need to take that into consideration for their year-end planning. While capital gain distributions are expected to be lower than we have seen them this decade, interest rates are near high levels for the decade.
(Click image to enlarge)
Source: St. Louis Fred, yCharts, Barclays and the U.S. Securities and Exchange Commission. All data as of 11/30/2023, except Money Mkt which is as of 10/30/2023. 10 Year Treasury: daily Market Yield on U.S. Treasury Securities at 10-Year Constant Maturity, Quoted on an Investment Basis, 1 Year CD: U.S. 1 Year CD Rate, U.S. Aggregate Bond: Daily yield to worst for the Bloomberg U.S. Aggregate Bond Index, Money Mkt: Daily Weighted 7 day gross yield on Prime Retail Money Market fund (Fund Statistics [Table 3]).
Tax-exempt municipal bond funds should be a strong consideration for investors in light of this higher interest rate picture. While the coupon yields appear lower on municipal bonds, part of that is due to their tax-advantaged nature. What's important to look at is the tax-equivalent yield, as that paints a more complete after-tax picture for investors.
(Click image to enlarge)
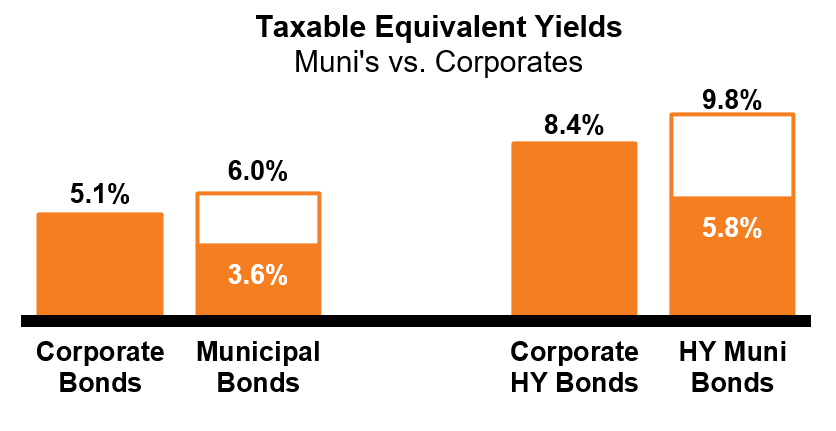
Source: Barclays. As of 11/30/2023. Yield quoted represents the Yield-to-Worst as of 9/30/2022. Bloomberg Barclays indices: IG Bond = U.S. Aggregate Bond Index; IG Municipal Bond = Municipal Bond Index; Sub-IG Corporate= U.S. Corporate High Yield Index; Sub-IG Municipal = High Yield Municipal Bond Index. Marginal Tax Rate used is 40.8% (37.0% + 3.8%).: Income from municipal bonds may be subject to state or local taxes and/or the federal alternative minimum tax.
Summary – No free tax ride this year
In summary, while capital gains distributions are expected to be lower than the prior two years, there will still be tax consequences. Taxes will need to be paid on the capital gains distributions received; and now there is a new wrinkle to many investors' tax pictures given the substantially higher interest income they may receive. Many investors should not expect a reduction in their tax cost from their investments.
We believe this is a great time to give strong consideration to tax management as part of your new-year planning. Taxes are one of the largest costs investors pay year-in and year-out. A carefully curated portfolio focusing on tax management could be in the best interest of many taxable investors no matter their risk profile.
More By This Author:
Is A U.S. Recession Still Possible In 2024?2024 Global Market Outlook: The Twilight Zone
Inflation Eases In Australia. Is The End Of The RBA’s Rate-Hiking Cycle Near?


Comments
Log in or sign up to join the conversation.