
Bulls Charge To All-Time Highs

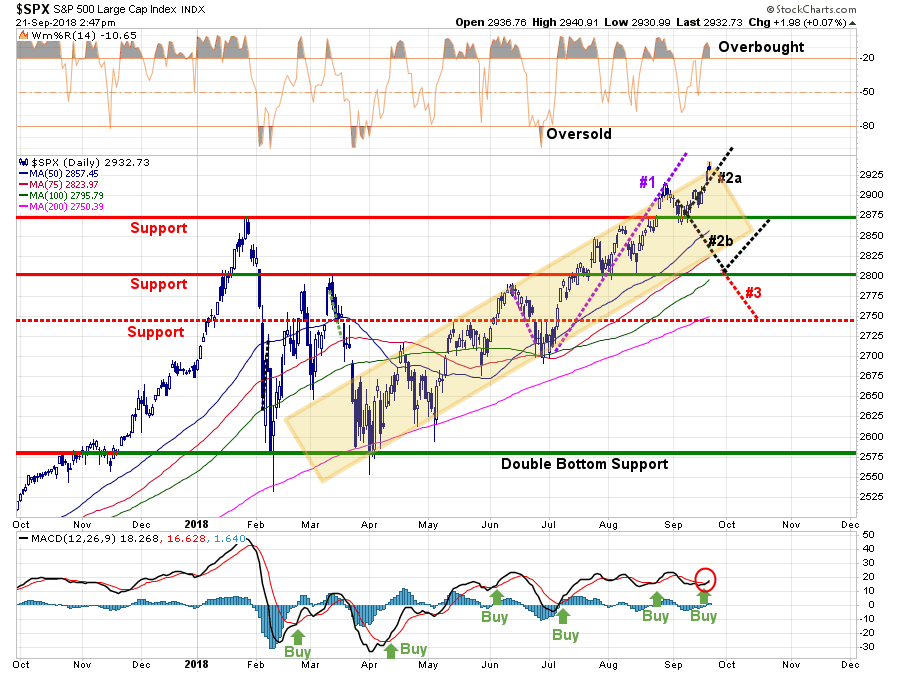
Get out your party hats ladies and gentlemen, the markets hit all-time highs this past week.
After increasing equity exposure in portfolios on the 11th, as the markets pulled back to the previous break-out support levels, I suggested a push to new highs was likely.
“The pullback to the previous breakout support level did allow us to add further exposure to our portfolios as we said we would do last week.
(If you want to see our portfolios they are now online at RIAPRO.net.)
Next week, the market will likely try and test recent highs as bullish momentum and optimism remain high. Also, with many hedge funds lagging in performance this year, there is likely going to be a scramble to create some returns by year end. This should give some support to the rally over the next couple of months. However, as shown above, the short-term oversold condition which fueled last week’s rally has been exhausted, so it could be a bumpy ride higher.
The breakout above the January highs now puts 3000 squarely into focus for traders.”
As shown, the breakout continues to follow Pathway #2a as we laid out almost 6-weeks ago. (Next week, I will update the pathways for the rest of this year.)
While the recent rally has been useful in getting capital successfully allocated, we are still maintaining prudent management processes.
- Stop-loss levels have been moved up to recent lows.
- We added defensive positions to our Equity and Equity-ETF portfolios.
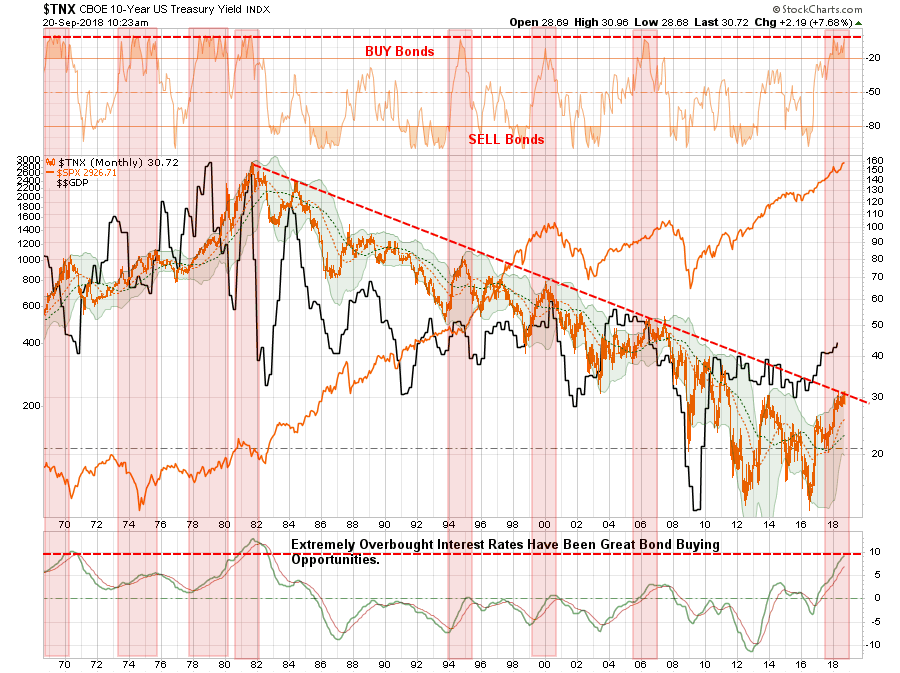
- With yields back to 3% on the 10-year Treasury, we are looking to add additional exposure to our bond holdings.
As I noted previously, we continue to use dips in bond prices to be buyers. This is because the biggest gains over the next 5 years will come from Treasury bonds versus stocks.
This is primarily due to the analysis, I penned yesterday on interest rates:
“While the market has been rising on stronger rates of earnings growth, due primarily to tax cuts and share buybacks, that effect will begin to roll off in the months ahead. Tariffs and higher interest costs are a direct threat to bottom line profitability, particularly when combined with higher labor costs.”
“There are several important points to note in the chart above:
- In the past 40-years, there have only been seven (7) other occasions where rates were this overbought. In each case, it was a great time to buy bonds and sell stocks. (When rates got oversold, it was time sell bonds and buy stocks.)
- There were only two (2) other periods where rates were this extended above their long-term moving averages. The one that occurred between 1980-1982 began the long-term decline in bond prices.
- Economic growth has peaked every time rates got this extended. (Which shouldn’t be a surprise.)
- Whenever rates have previously pushed 2-standard deviations of their 2-year moving average – bad things have tended to occur such as the Crash of 1974, Crash of 1987, Long-Term Capital Management, Russian Debt Default, Asian Contagion, Dot.com crash, and the Financial Crisis.”
While the markets are currently ignoring the risk of higher rates, even a cursory glance at the chart above suggests that we are near the point where “rates will matter.”
Remember, credit is the “lifeblood” of the economy and with consumer credit now at record levels, and 80% of Americans vastly undersaved, think about all the ways that higher rates impact economic activity in the economy:
1) Rising interest rates raise the debt servicing requirements which reduces future spending and productive investment.
2) Rising interest rates will immediately slow the housing market taking that small contribution to the economy away. People buy payments, not houses, and rising rates mean higher payments.
3) An increase in interest rates means higher borrowing costs which leads to lower profit margins for corporations.
4) The “stocks are cheap based on low interest rates” argument is being removed.
5) The massive derivatives and credit markets are at risk. Much of the recovery to date has been based on suppressing interest rates to spur growth.
6) As rates increase so does the variable rate interest payments on credit cards.
7) Rising defaults on debt service will negatively impact banks.
8) Many corporate share buyback plans and dividend issuances have been done through the use of cheap debt, which has led to increases corporate balance sheet leverage.
9) Corporate capital expenditures are dependent on borrowing costs. Higher borrowing costs lead to lower CapEx.
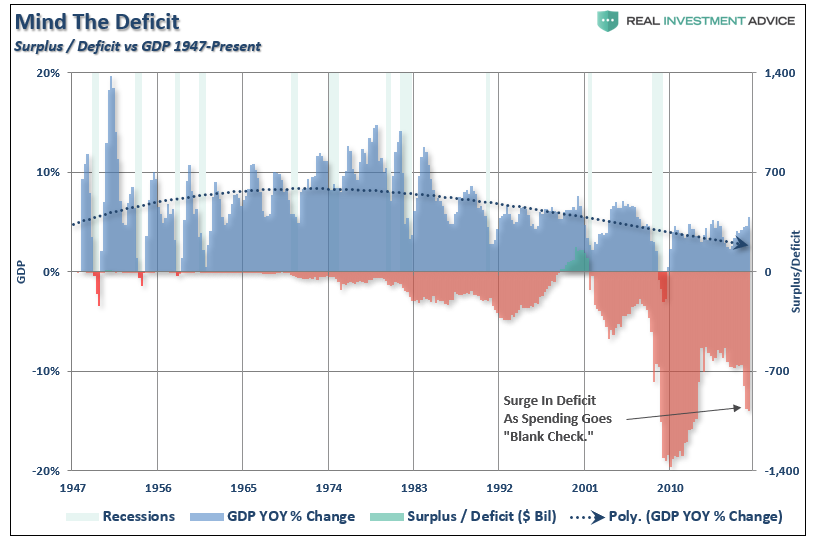
10) The deficit/GDP ratio will begin to soar as borrowing costs rise sharply. The many forecasts for lower future deficits will crumble as new forecasts begin to propel higher.
I could go on, but you get the idea.
The issue is not if, but when, the Fed hikes rates to the point that something “breaks.”
However, between now and then, the markets will likely continue to try and push higher as investor confidence continues to swell, pushing investors to take on ever increasing levels of risk, particularly as it appears as if the economy is firing on all cylinders.
But is it really?
Economic Growth Likely Fleeting
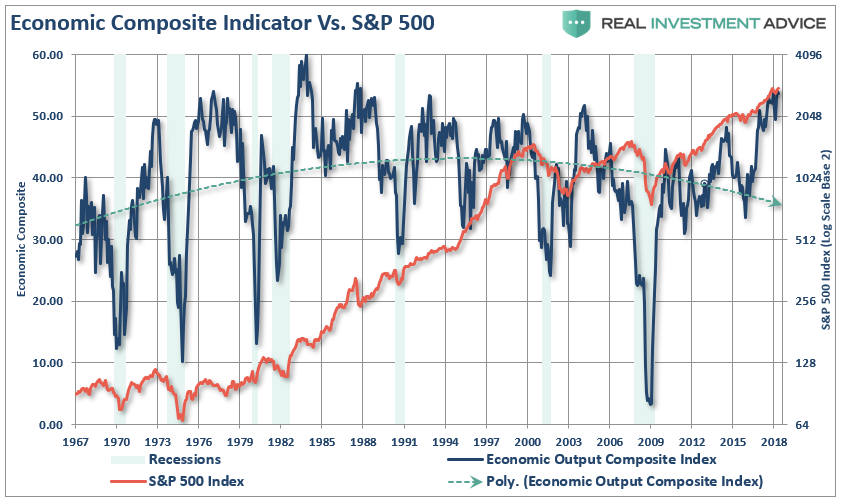
Economic data has certainly surprised to the upside in the U.S. as of late with unemployment numbers hitting lows, manufacturing measures coming in “hot” and consumer confidence at record highs. As I discussed just recently, the RIA EOCI (Economic Output Composite Index) is near its highest level on record.
(The index is comprised of the CFNAI, ISM Composite, several Fed regional surveys, Chicago PMI, Markit Composite, PMI Composite, Economic Composite, NFIB Survey, and the LEI.)
But is this recent surge part of a broader, stronger, and sustainable economic recovery?
If you notice in the chart above, these late-stage surges in economic growth are not uncommon just prior to the onset of a recession. This is due to the cycle of confidence which tends to peak at the end of cycles, rather than the beginning. (In other words, when everything is as good as it can get, that is the point everyone goes “all in.”)
However, the most recent surge in the economic data has been the collision of tax cuts, a massive surge in deficit spending, the impact of the rebuilding following several natural disasters late last year, and most importantly, the rush by manufacturers to stock up on Chinese goods ahead of the imposition of tariffs. To wit:
“By plane, train, and sea, a frenzy has begun, resulting in surging cargo traffic at US ports, booming air freight to the US, and urgent dispatch of goods from Chinese companies earlier than planned. Getting in under the wire before Trump’s tariffs bite could mean hundreds of thousands saved on single shipments.
Bloomberg describes this week that cargo rates for Pacific transport are at a four-year high as manufacturers rush to get everything from toys to car parts to bikes into American stores.
This rush, which comes on top of a typically already busy pre-holiday season, is expected to continue well after next week as the tariff will leap from 10 to 25 percent after the new year.
US importers are expected to stockpile Chinese products before the 2019 25% mark. There’s currently widespread reports of companies scrambling to pay expedited air freight fees to dodge the new tariffs, as well as move up their orders. “
This is an important point. Not only has this been the case just recently, but since the beginning of this year when the White House began this nonsensical “trade war.”
“Of course, the most likely outcome will be a return to trade at about the same level as it was just prior to the initiation of “trade wars.” However, it will be a “return to normal,” rather than an actual improvement, but it will give the White House a “win” for solving a problem it created. “
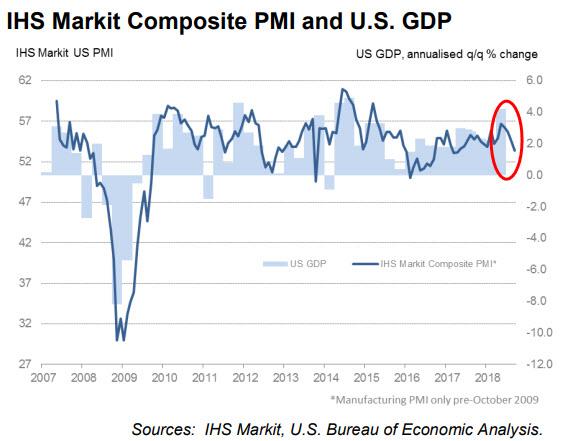
However, this is really a tale of “two economies” as the surge in the economic data is almost solely coming from the manufacturing side of the equation. As shown, the “service” side, which is more immune to the effects of tariffs, has been declining over the past several months.
Of course, while so-called “conservative Republicans” are breaking their arms to pat themselves on the back for “getting the economy going again,” the reality is they have likely doomed the economy to another decade of sluggish growth once the short-term burst from massive deficit spending subsides. The unbridled surge in debt and deficits is set to get materially worse in the months ahead as real revenue growth is slowing.
All of this underscores the single biggest risk to your investment portfolio.
In extremely long bull market cycles, investors become “willfully blind,” to the underlying inherent risks. Or rather, it is the “hubris” of investors they are now “smarter than the market.” However, there is a growing list of ambiguities which are going unrecognized may market participants:
- Growing divergences between the U.S. and abroad
- Peak autos, peak housing, peak GDP.
- Political instability and a crucial midterm election.
- The failure of fiscal policy to ‘trickle down.’
- An important pivot towards restraint in global monetary policy.
- An unprecedented lack of coordination between super-powers.
- Short-term note yields now eclipse the S&P dividend yield.
- A record levels of private and public debt.
- Near $3 trillion of covenant light and/or sub-prime corporate debt. (eerily reminiscent of the size of the subprime mortgages outstanding in 2007)
- Narrowing leadership in the market.
Yes, At the moment, there certainly seems to be no need to worry.
The more the market rises, the more reinforced the belief “this time is different” becomes.
But therein lies the single biggest risk to the Fed and your portfolio.
“Bull markets” don’t die of pessimism – they die from excess optimism.
S&P Reshuffles
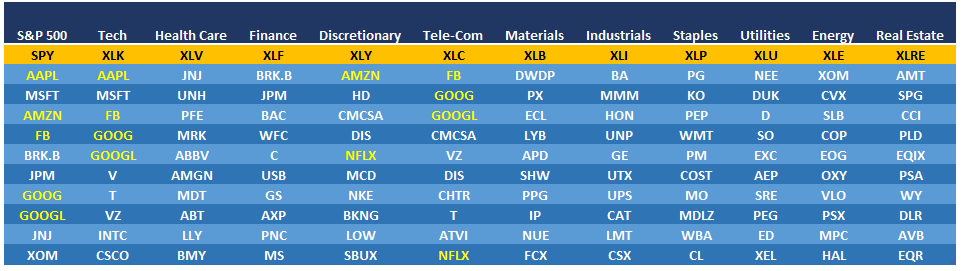
I noted a couple of weeks ago the S&P 500 was reshuffling the makeup of the sector weightings. To wit:
Just for your reference here are the top-10 holdings of the ETF’s currently which will change on September 21st. I have highlighted the 4-FANG stocks.
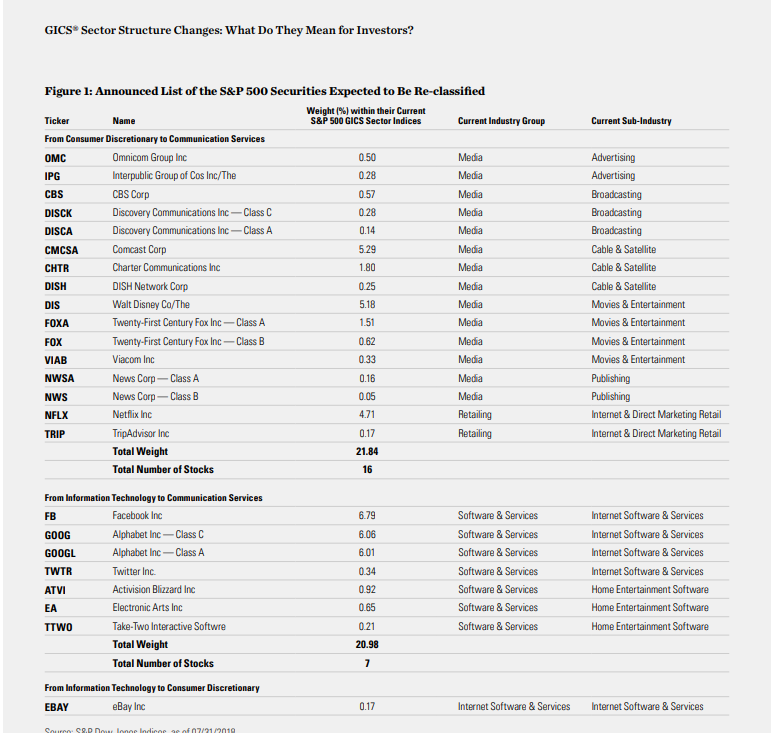
However, here is a full list of the stocks to be reclassified.
As noted, the telecommunications sector is likely to become much more volatile. Furthermore, if you are benchmarking your portfolio, you will need to make sector weighting changes as well.
Market & Sector Analysis
Data Analysis Of The Market & Sectors For Traders
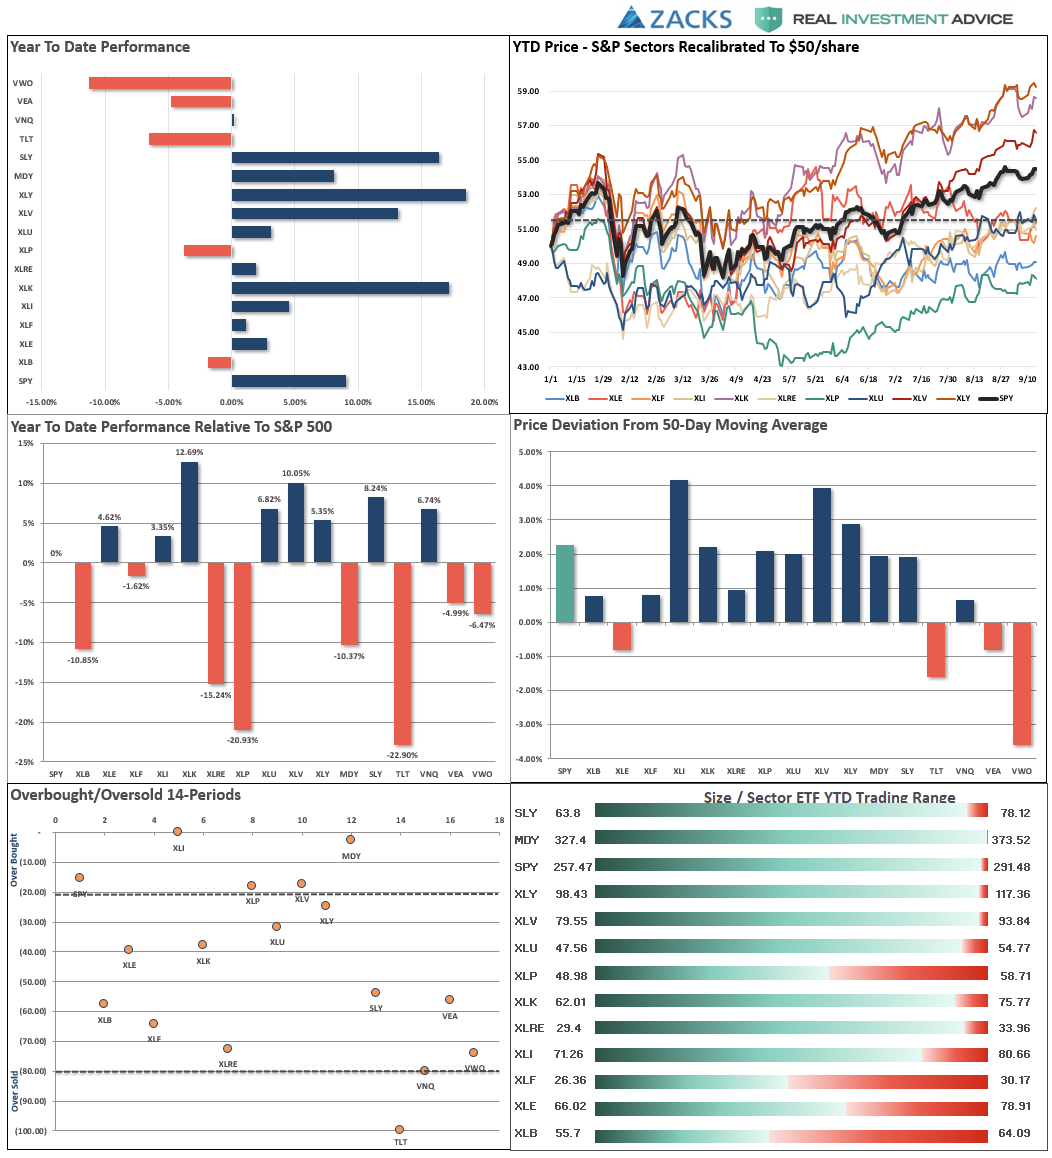
S&P 500 Tear Sheet
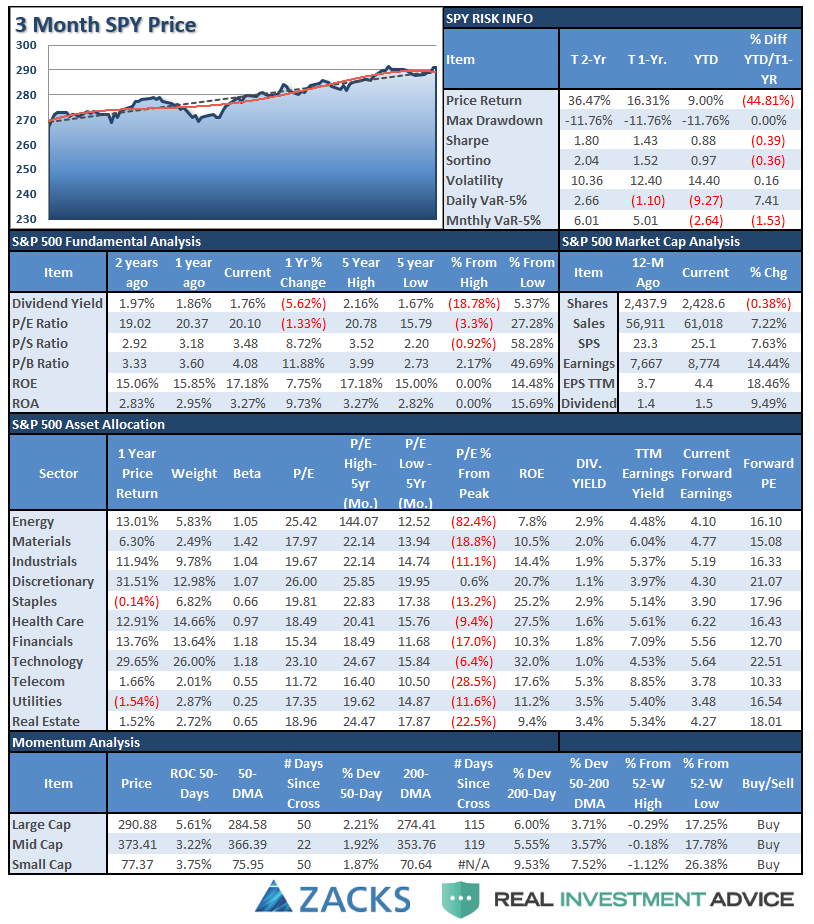
Performance Analysis
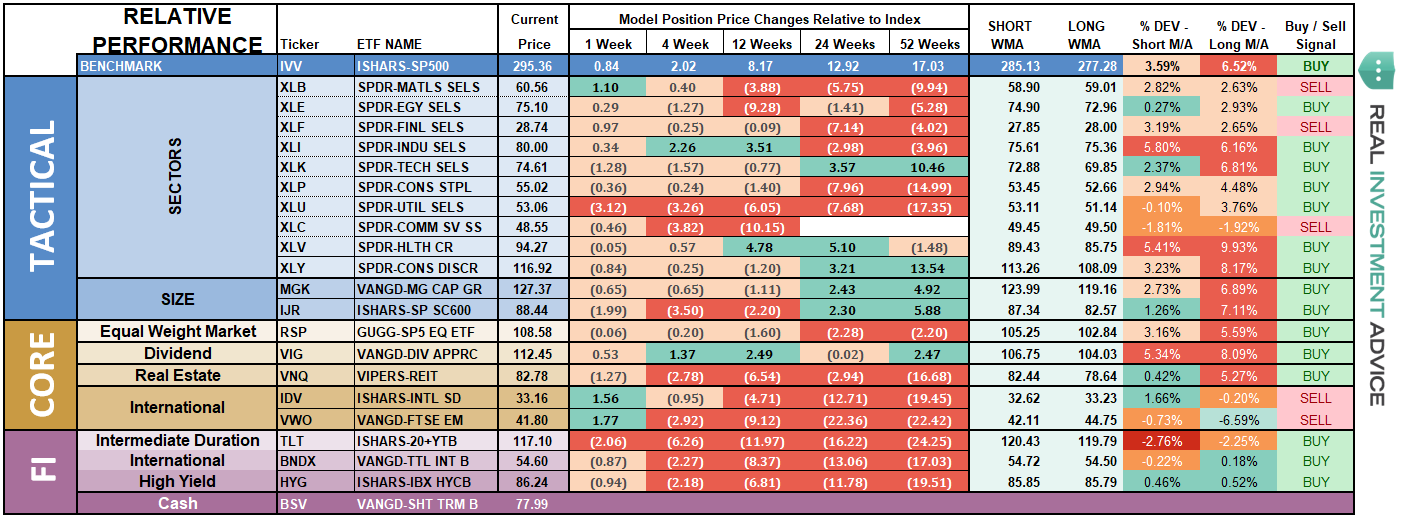
ETF Model Relative Performance Analysis
Sector & Market Analysis:
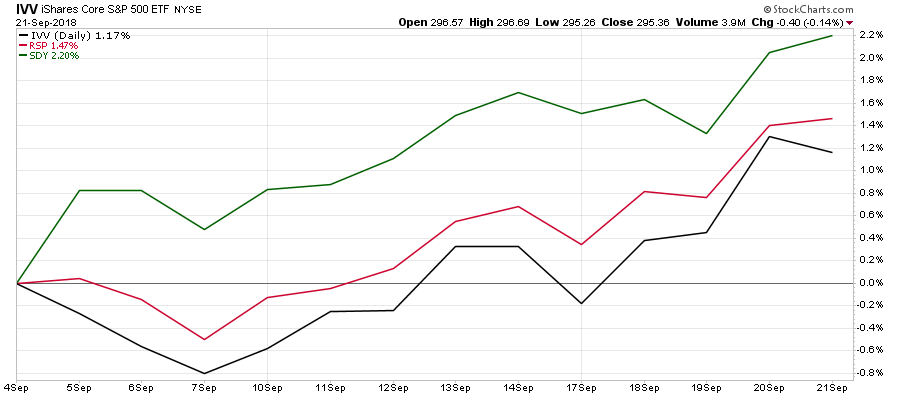
As I noted, the S&P 500 sectors have been shuffled up a bit. As such, I have changed the two charts below. The S&P analysis now includes both XLC and XLRE. I have also added the S&P 500 index just for comparative purposes.
Since real estate was moved up from the major markets graph, I have added a pure S&P 500 index for comparative performance to the equal weight and dividend weighted indices.
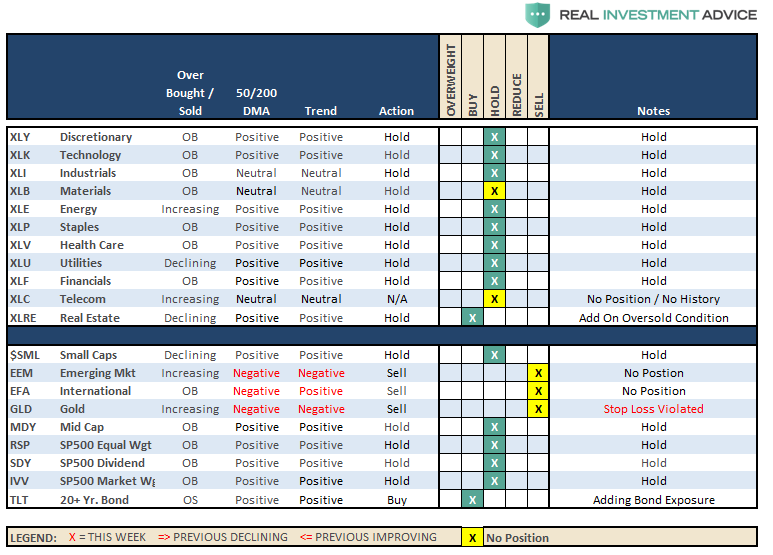
Sector-by-Sector
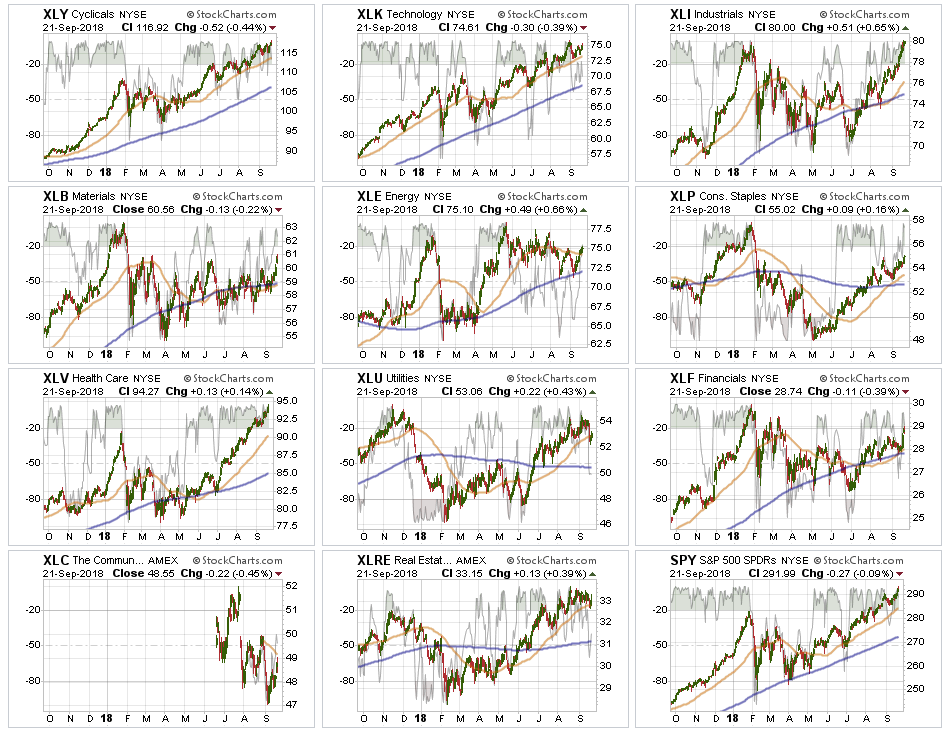
Industrials and Healthcare were once again the clear winners last week. With the 50-dma crossing above the 200-dma in Industrials, the bullish bias is back in place. Despite the threat of trade wars and tariffs, investors chased industrial stocks looking for a rotation trade from overbought Discretionary and Technology sectors. Healthcare’s recent run continues but is grossly extended. These sectors are now extremely overbought, so take profits and rebalance weights back to target allocations. Look for pullbacks to the 50-dma to add exposure.
Discretionary, Technology, and Staples – The trend higher in these sectors continues, and with the 50-dma crossing above the 200-dma in the Staples sector, our add to this sector earlier this year continues to perform well. Pullbacks to the 50-dma will provide better entry points in otherwise very overbought sectors currently.
Utilities and Real Estate – continues their bullish trends but got impacted last week from the spurt above 3% in interest rates. With investors back “chasing yield” the bullish trends are clearly in place. However, use pullbacks to support and oversold conditions to add exposure accordingly.
Financial, Energy, and Materials – continue to lag the rest of the market. Despite a recent tick up in oil prices, Energy remains in a downward trend currently. However, the 200-dma has been a good entry point for trading opportunities. Energy did break above the 50-dma last week, so a rally higher is likely if oil prices continue to rise. Stops should remain at the recent lows. Financials continue to languish along support but not showing much in the way of strength to support overweighting the sector currently. Materials finally broke higher last week as “trade fears” eased but news over the weekend will likely reverse this sector next week. Let’s wait and see what happens.
Telecommunications – with the new reshuffle in this sector could well see a pick up in volatility. There is no reason to add this sector to holdings right now as there simply isn’t enough data yet to determine much of anything from a trading perspective. We will watch this over the next couple of months to see how things develop.
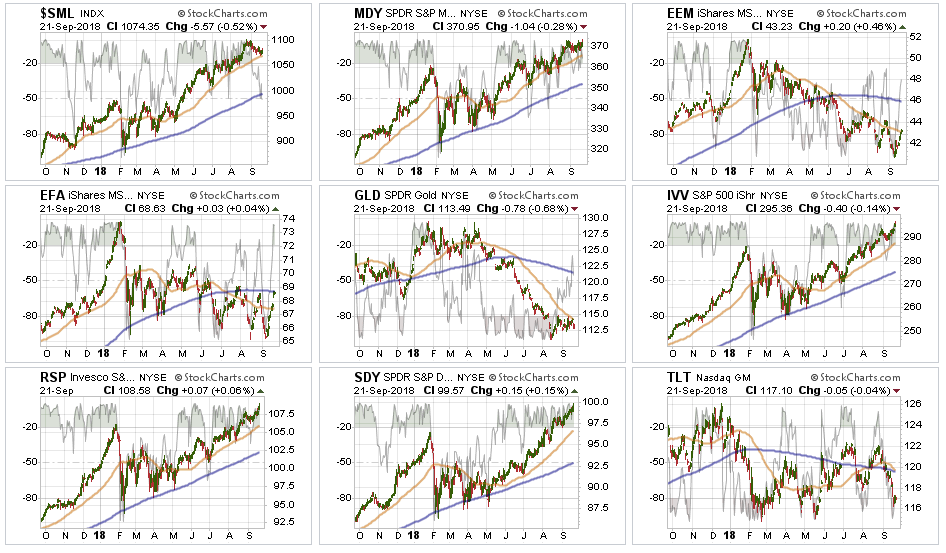
Small-Cap and Mid Cap we noted three weeks ago that these markets were extremely overbought and extended, and a pullback to support was needed. Mid-cap has performed better but is short-term overbought. Small-caps have begun to work off their overbought condition as of late which is good and we will look for an opportunity to add exposure as needed.
Emerging and International Markets as I noted last week.
“Both sectors rallied a bit last week, providing an opportunity to reduce exposure for the time being and reallocate that capital to better performing areas. WHEN international and emerging markets begin to perform more positively we will add positions back to portfolios. There is just no reason to do so now.”
That advice remains the same this week.
Dividends, Market, and Equal Weight – we added a pure S&P 500 index fund to our “core” holdings which will add some beta to the portfolio but acts as a placeholder for sectors and markets we have no allocation to (ie, international markets, gold, basic materials.) We continue to hold our allocations to these “core holdings” and continue to build around these core with tactical positions that provided opportunistic advantages. As noted in the sector allocations above, “the dividend chase” is “back” as the dividend index has sharply outperformed the broader market.
Gold – failed at the 50-dma this past week. This was your opportunity to sell your holdings for the time being. Stops remain firm at $111 again this week.
Bonds – bonds sold off last week on the spurt in interest rates back above 3%. With bonds back on strong support at recent lows, and very oversold, we are looking to add bond exposure to our portfolios. We are moving our stop to $114 for trading positions.
The table below shows thoughts on specific actions related to the current market environment.
(These are not recommendations or solicitations to take any action. This is for informational purposes only related to market extremes and contrarian positioning within portfolios. Use at your own risk and peril.)
Portfolio/Client Update:
As noted, two weeks ago, with the market holding support above the “breakout” levels from January, we added exposure to portfolios. We took the following actions in Client accounts:
- New clients: Added 50% of target equity allocations.
- Equity Model: Semiconductors (MU & KLAC) remain on “Sell Alerts” – we are monitoring these positions closely and stop-loss levels have been tightened up. We added positions in JNJ, CVS, NKE, FDX, DUK, PEP, and WMT. We also brought existing positions up to full weight where needed.
- Equity/ETF blended – Same as with the equity model.
- ETF Model: We overweighted the core “domestic” indices by adding a pure S&P 500 index ETF to offset lack of international exposure. We remain overweight outperforming sectors to offset underweights in under-performing sectors.
- Option-Wrapped Equity Model – We added PEP and JNJ to the portfolio and brought existing positions up to full-weights as needed.
There were no changes last week as the bulk of our positions are currently working as expected. However, as we have repeatedly stated, we are well aware of the present risk. Stop loss levels have been moved up to recent lows and we continue to monitor developments on a daily basis. With the trend of the market positive, we want to continue to participate to book in performance now for a “rainy day” later.
It is important to understand that when we add to our equity allocations, ALL purchases are initially “trades” that can, and will, be closed out quickly if they fail to work as anticipated. This is why we “step” into positions initially. Once a “trade” begins to work as anticipated, it is then brought to the appropriate portfolio weight and becomes a long-term investment. We will unwind these actions either by reducing, selling, or hedging, if the market environment changes for the worse.
THE REAL 401k PLAN MANAGER
The Real 401k Plan Manager – A Conservative Strategy For Long-Term Investors
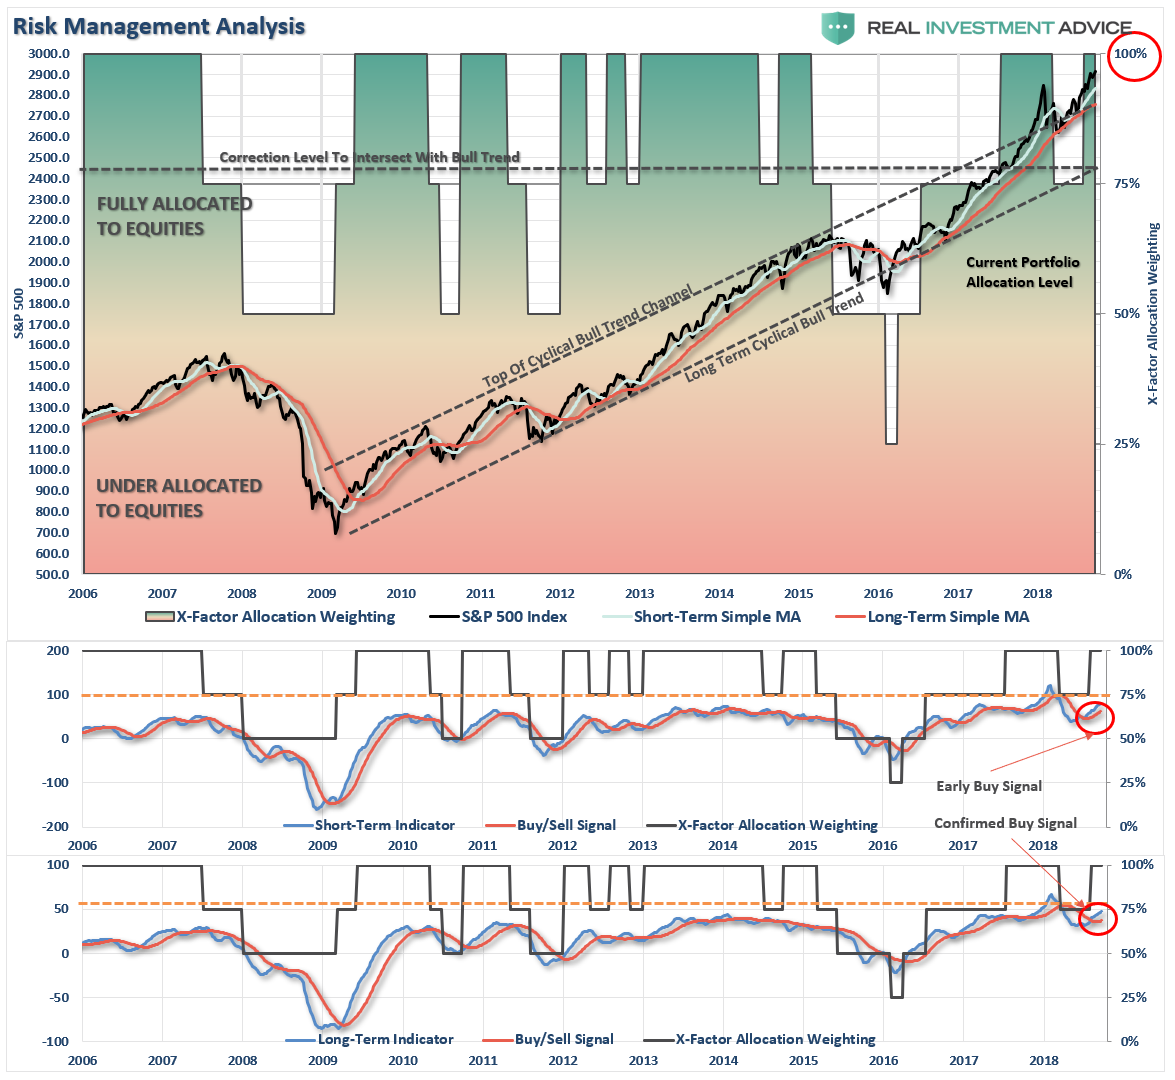
There are 4-steps to allocation changes based on 25% reduction increments. As noted in the chart above a 100% allocation level is equal to 60% stocks. I never advocate being 100% out of the market as it is far too difficult to reverse course when the market changes from a negative to a positive trend. Emotions keep us from taking the correct action.

Just Watching The Show
With the move in portfolios back to full target allocations, there is not much for us to do right now except to remain on the lookout for the risks which could rapidly take away our performance.
While there are certainly plenty of resources to tell you why the market should go up from here, which is great if it does because we are allocated to the market, we only need to be concerned with what could now disrupt the bullish advance.
At the moment, we are in good shape just to sit back and “watch the show.”
Continue using the following guidelines for now.
- If you are overweight equities – reduce international and emerging market exposure and add to domestic exposure if needed to bring portfolios in line to target weights.
- If you are underweight equities – increase exposure towards domestic equity to levels where you feel comfortable. There is no need to go “all in” at one time. Step in on any weak days.
- If you are at target equity allocations currently just rebalance weights to focus on domestic holdings.
Remember, this is your “retirement money.”
This is the one account you don’t want to #$%! up. Not only do you destroy capital, you also destroy the tax deferral as well as the company match. Be more conservative with your allocations in your 401k-plan because you have less flexibility and fewer options. This is also the one account that is your “safety net” if everything else in life goes wrong.
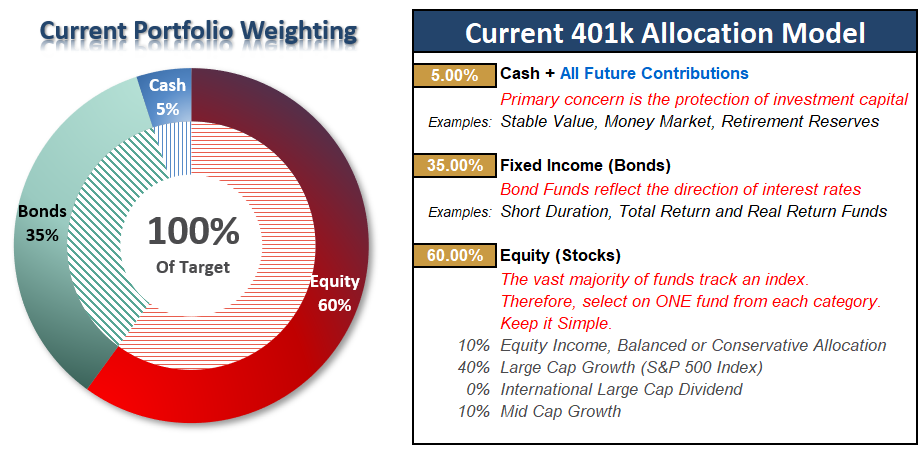
Current 401-k Allocation Model
The 401k plan allocation plan below follows the K.I.S.S. principle. By keeping the allocation extremely simplified it allows for better control of the allocation and a closer tracking to the benchmark objective over time. (If you want to make it more complicated you can, however, statistics show that simply adding more funds does not increase performance to any great degree.)
401k Choice Matching List
The list below shows sample 401k plan funds for each major category. In reality, the majority of funds all track their indices fairly closely. Therefore, if you don’t see your exact fund listed, look for a fund that is similar in nature.

Disclosure: The information contained in this article should not be construed as financial or investment advice on any subject matter. Real Investment Advice is expressly disclaims all liability in ...
more

