
Breakout By 10-Year Yields Suggesting Upside Target Of 6% Yields?
(Click on image to enlarge)
Interest rates remain in the spotlight with investors watching every economic data release and wondering when the Federal Reserve will stop raising rates.
Well, one way to gauge this environment is to watch the 10-Year US Treasury bond yield. And as you guessed, it’s been heading higher for a while now.
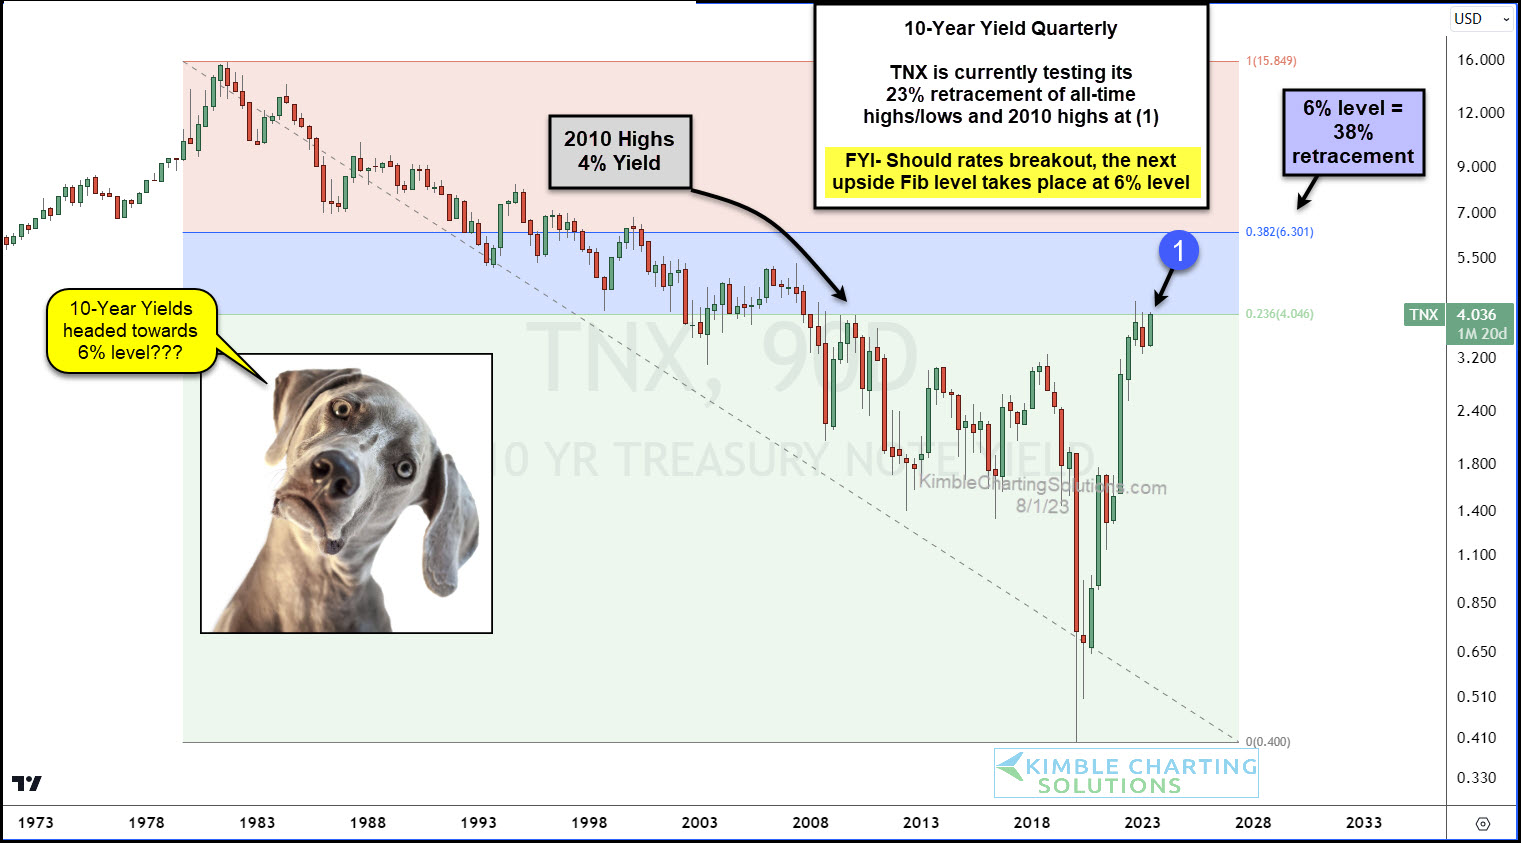
And today’s long-term “quarterly” chart highlights a historic Fibonacci breakout resistance level at (1).
The 10-year yield is testing the 23% Fibonacci retracement level right now. This is a HUGE test for yields to continue.
And should the 10-year breakout and close the quarter above (1) it would open up the potential for yields to move to the next Fibonacci target around 6%. There’s a lot at stake here for consumers and bond traders! Stay tuned!
More By This Author:
Dumb Money Indicators Hits Extreme Level, Frothy Signs For Tech?
Large Cap Tech Eyeing Massive Implication Level Says Joe Friday
Are Semiconductors (SMH) Setting Up For A Historic Breakout or Double Top?
Disclosure: Sign up for Chris's Kimble Charting Solutions' email alerts--click here.


