
Breaking Down The Bull/Bear Argument
Really! Another week of nowhere?
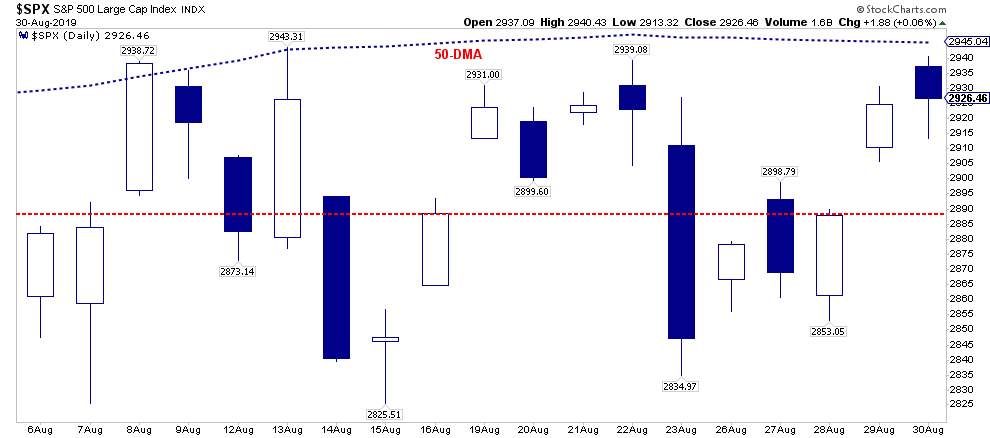
This is the same chart from last week, updated, but here is the salient point.
“This has been an impossible market to effectively trade as rhetoric between the White House, the Fed, and China has reached a fevered pitch.”
Don’t fall into the trap.
On Thursday, the market rallied as China said they were not going to retaliate against the U.S. on trade immediately. They also stated they wanted to take a “calm” approach to the discussions.
The media, and Wall Street, heard: “Trade Deal.”
That is NOT the case by any stretch of the imagination.
China is playing a very long game. The pressure is on the Trump Administration to conclude a ‘deal,’ not on China.Trump needs a deal done before the 2020 election cycle, AND he needs the markets and economy to be strong. If the markets and economy weaken because of tariffs, which are a tax on domestic consumers and corporate profits, as they did in 2018, the risk-off electoral losses rise. China knows this and is willing to ‘wait it out’ to get a better deal. China is not going to jeopardize its 50 to 100-year economic growth plan on a current President who will be out of office within the next 5-years at most.”
What China has figured out is they can easily manipulate Trump into giving up strategic positioning by offering to “talk.” This continues to be an effective strategy since they know Trump’s re-election is contingent upon a strong U.S. economy, and stock market. By slow-rolling progress, and agreeing to “talk” Trump has given up ground to support U.S. corporations. At the G-20 he agreed to allow companies to sell products to Huawei. Then, he delayed tariffs until December on major consumer goods, which would have negatively impacted U.S. corporations Christmas selling season.
In exchange, China has done…nothing.
This is the same trap I warned Trump would fall into with North Korea over nuclear weapons. To wit:
“As a dictator, he [Kim Jung Un] can not afford to show weakness. Therefore, he needs the U.S. to acquiesce to some degree to allow him to claim victory over the ‘evil empire’ of the west. By continuing to bring Trump to the table to ‘talk,’ he doesn’t give up anything. However, the ‘talks’ continue to buy time to continue his missile development.”
Today, there is “no deal” with either North Korea or China.
In the coming weeks, China will once again come to the table, they will make concessions, which will temporarily excite the markets, and then they will default on those agreements. Trump will get mad, he will slap more tariffs on China, and the entire cycle will begin again.
The risk, however, with tariffs already engaged, is whether economic growth falters before the upcoming election. An economic downturn prior to the 2020 election is the greatest threat to Trump’s re-election. This is precisely what China is trying to achieve which would give them tremendous bargaining power over Trump.
One thing is certain, there will be much more volatility between now, and the end of the year.
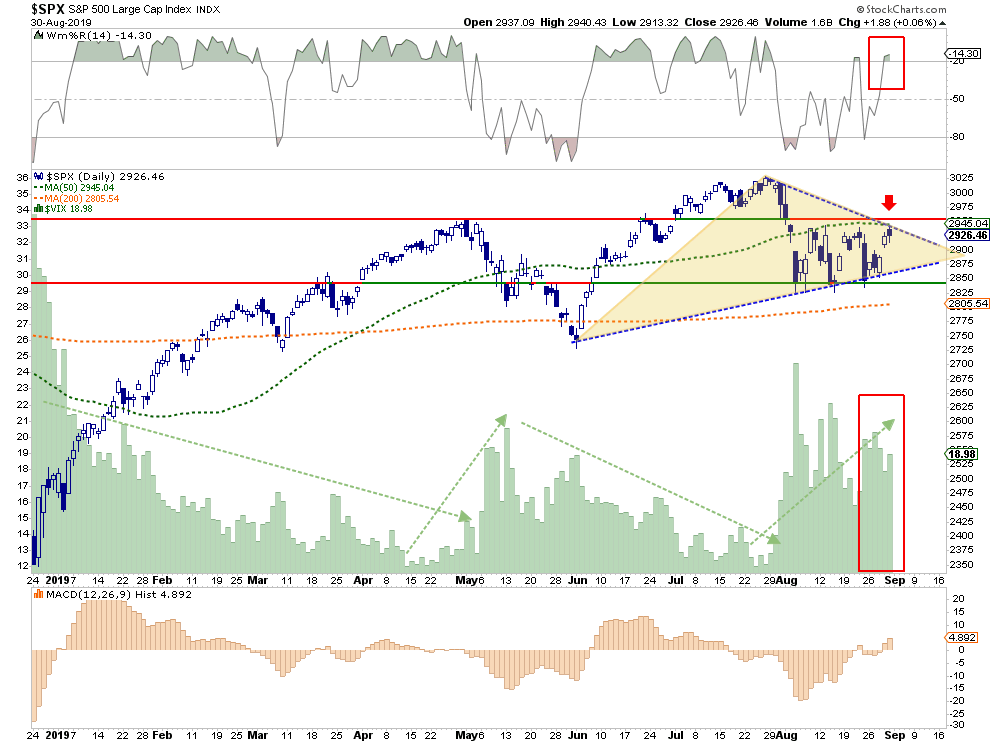
From a short-term market perspective, the risk is to the downside next week:
- Historically, September is one of the weakest months of the year, particularly when it follows a weak August.
- The market remains range bound and failed at both the 50-dma and downtrend line on Friday
- The oversold condition has now reversed. (Top panel)
- Volatility is continuing to remain elevated.
- Important downside support moves up to 2875
- The bulls regain control of the narrative on a breakout above 2945.
It is from this perspective that we continue to hold an overweight position in cash (see 8-Reasons), have taken steps to improve the credit-quality in our bond portfolios, and shifted our equity portfolios to more defensive positioning.
For now, the reduced volatility, and hedges, continue to allow us to navigate market uncertainty until a better risk/reward opportunity presents itself.
Breaking Down The Bull/Bear Argument
I received an interesting email on Thursday (I have reformatted the email for readability.)
“According to the legend, Martin Armstrong most people get caught at the top when the trend turns on them.Likewise, we know the story that when the shoeshine guy giving stock tips; you know its time to sell.
It looks to me like we find ourselves in a radically different predicament.
- The S&P 500 is still just a stone’s throw away from all-time highs, yet the sentiment everywhere is decidedly bearish. The shoe shine guy (if I could find one) would be telling us to sell everything.
- There have been record outflows from the market for months, if not years, and the sky is going to fall on everyone tomorrow.
- There is record amounts of cash on the sidelines due to fear.
I cannot get this combination of facts to jive. The “herd” does not have a very good track record of making great timing calls on the market and I literally cannot find one bull anywhere. I would feel a lot better about calling a turn in the market if everyone and their brother was bullish.”
The email is a great example of the “quandary” facing investors currently. On the one hand, there is troubling economic data and “trade wars,” which provide a logical concern for investors with capital at risk. But, on the other hand, the “algos” which make up roughly 80% of the trading in the markets are knee-jerking every “trade,” or “Fed,” related headline keeping asset prices elevated near all-time highs.
What do you do?
The answer is “nothing.”
As we noted previously, sometimes, when the path forward is unclear, and volatility is high, the best thing to do is to “sit on your hands” and wait for the market to “tell” you what to do next. Over the last few weeks, being “long” equities has been frustrating. However, being “short” has been equally discouraging.
The email hits on a few of the “myths” which prevail in the markets currently. These are fairly important concepts to understand, so let’s break them down individually.
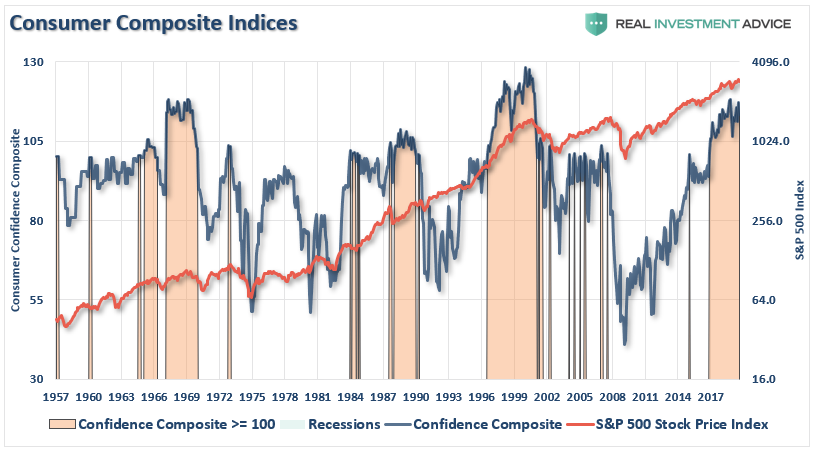
1) Sentiment Is Hardly Bearish
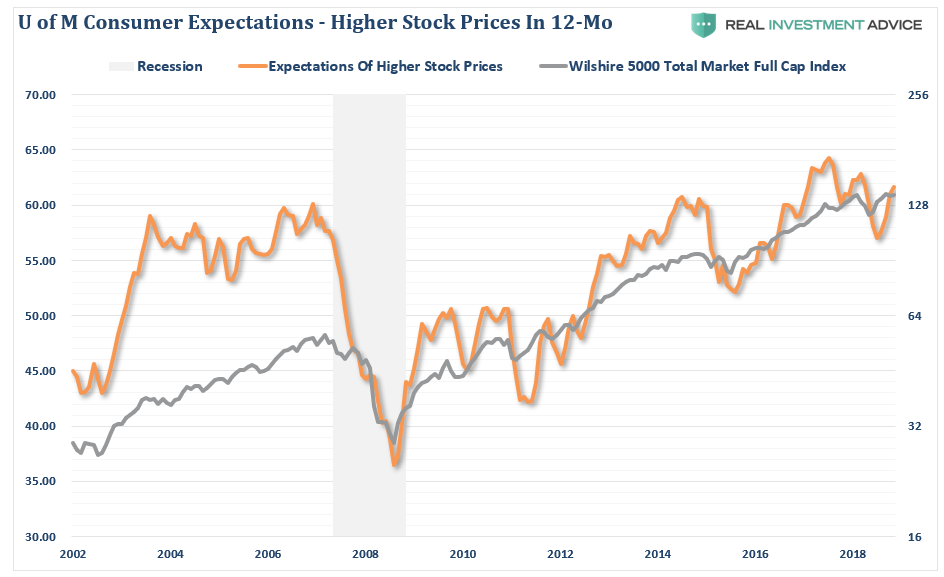
Currently, individuals could not be more confident about the markets or the economy. As shown in the chart below both investor confidence about the economy, and expected returns from stocks over the next 12 months, are near record highs, not lows.
Moreover, as I noted just recently in “When A Bond Bull Becomes A Raving Stock Bull,” the retail investor is just about as long-biased as they can get.
While it may “seem” like everyone is “bearish,” it isn’t the case. Part of this has to do with the “training,” investors have received over the last decade.
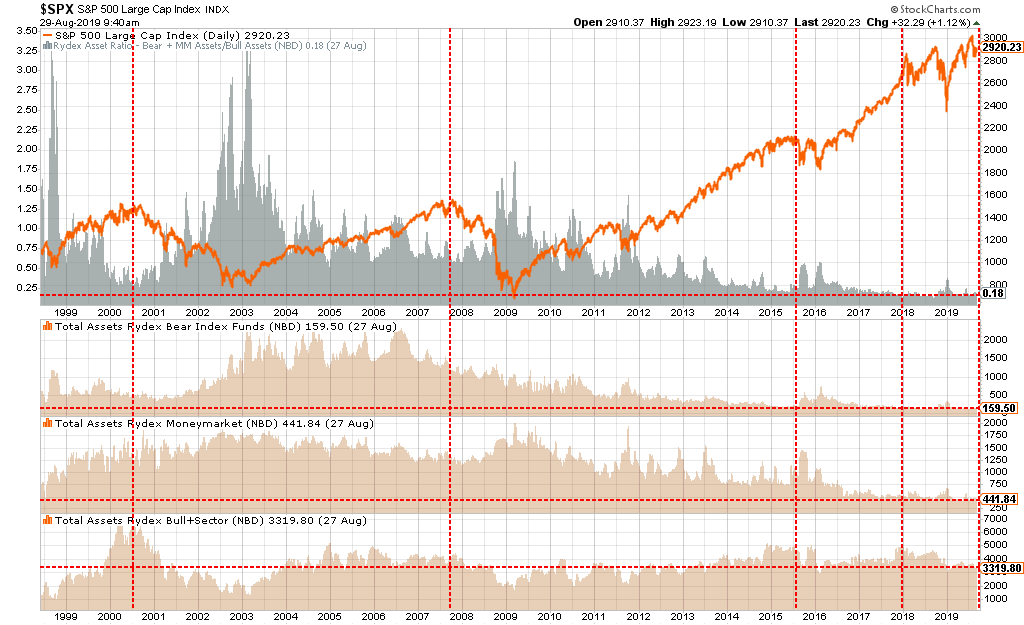
While some sentiment indicators clearly show a surge in bearish sentiment, which normally denotes a substantial level of fear by investors, there has been no substantial change to actual allocations.
While stock allocations have fallen modestly, cash and bond allocations have barely budged. This is a far different story than was seen during previous major and intermediate-term corrections in the market.
This suggests that while investors are worried about the markets and their investments, they are too afraid to actually make changes to their portfolio as long as Central Banks continue to support the markets.
“Are you afraid of a market crash? Yes.
Are you doing anything about it? No.”
This “fear” to do something, leaves lots of room for “panic” when something eventually breaks.
2) Record Outflows?
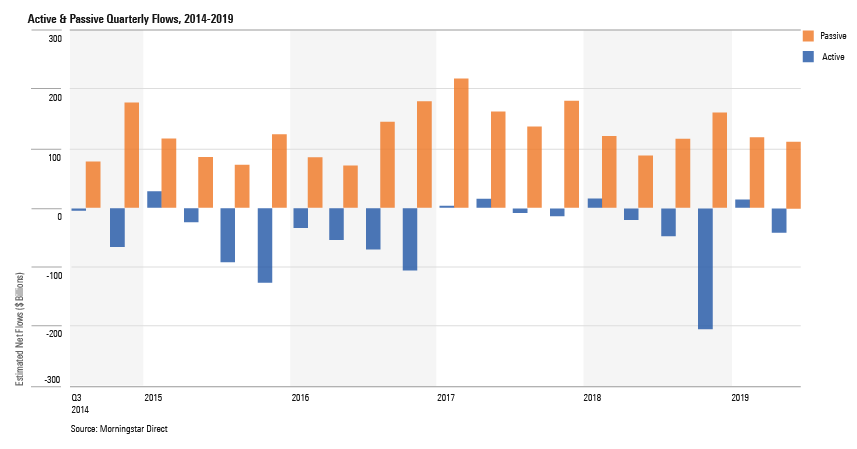
There has been lot’s of discussions about the record outflows from equities. That really isn’t the case as shown by the most recent fund flows analysis.
“Long-term fund flows enjoyed a solid second quarter and a robust first half of 2019. Long-term fund flows—open-end and exchange-traded funds—collected nearly $93 billion in the second quarter, a slight decrease from the first quarter’s $136 billion. In total, long-term fund flows collected $224 billion in the first half of the year, slightly ahead of 2018’s $219 billion.”
Of course, the crowding into ETF’s is a whole other “time bomb” waiting for unwitting investors.
“With more ETF’s than individual stocks, and the number of outstanding shares traded being reduced by share buybacks, the risk of a sharp and disorderly reversal remains due to compressed credit and liquidity risk premia. As a result, market participants need to be mindful of the risks of diminished market liquidity, asset price discontinuities and contagion across asset markets.
Secondly, individual investors are NOT passive even though they are investing in “passive” vehicles. Today, more than ever, advisors are actively migrating portfolio management to the use of ETF’s for either some, if not all, of the asset allocation equation. However, they are NOT doing it ‘passively.’
Just because individuals are choosing to “buy baskets” of stocks, rather than individual securities, it is not a ‘passive’ choice but rather ‘active management’ in a different form.
While the idea of passive indexing works while all prices are rising, the reverse is also true. The problem is that once prices begin to fall the previously ‘passive indexers’ will become ‘active panic sellers.’ The tables are once again set for a dramatic and damaging ending.”
Furthermore, it is hard to suggest there are record outflows when the market is extremely overbought. As Ned Davis noted:
“Stock market bulls have been arguing for months that muted stock market valuations and consistent equity-fund outflows are proof-positive that stock-market investors are not feeling the sort of euphoria that typically exists before the start of an economic recession or bear market. But a longer-term view of equity valuations and allocations indicates ‘excessive optimism.'”
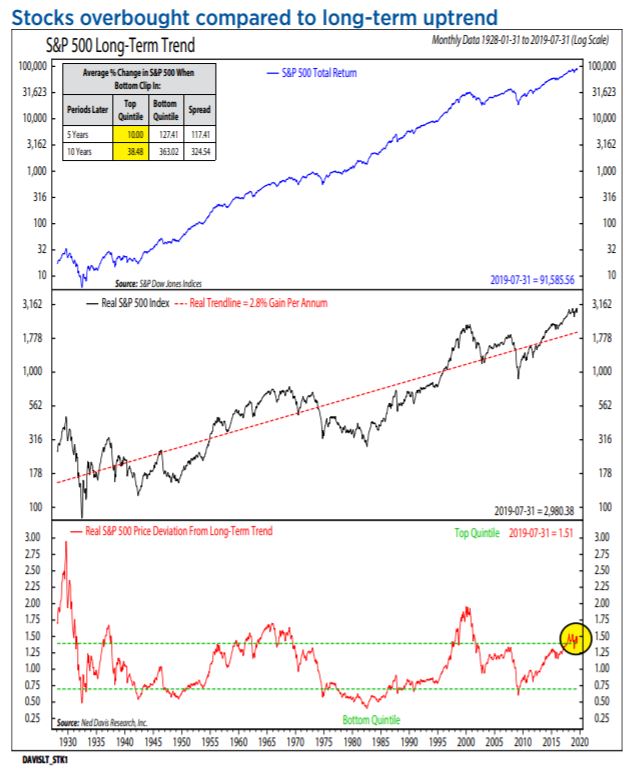
Davis, in a note, said that the value of the S&P is much higher today than the index’s average growth would predict. In fact, it’s higher relative to the average than it has been 80% of the time.
In other words, be careful of the idea that investors are unduly “bearish,” the reality is quite different.
3) The Myth Of Cash On The Sidelines
Despite eight years of a bull market advance, one of the prevailing myths that seeming will not die is that of “cash on the sidelines.” To wit:
“Underpinning gains in both stocks and bonds is $5 trillion of capital that is sitting on the sidelines and serving as a reservoir for buying on weakness. This excess cash acts as a backstop for financial assets, both bonds and equities, because any correction is quickly reversed by investors deploying their excess cash to buy the dip,” Nikolaos Panigirtzoglou, the managing director of global market strategy at JPMorgan, wrote in a client note.
Stop it.
This is the age-old excuse why the current “bull market” rally is set to continue into the indefinite future. The ongoing belief is that at any moment investors are suddenly going to empty bank accounts and pour it into the markets. However, the reality is if they haven’t done it by now after three consecutive rounds of Q.E. in the U.S., a 300% advance in the markets, and ongoing global Q.E., exactly what will that catalyst be?
Clifford Asness previously touched on this issue as well.
“There are no sidelines. Those saying this seem to envision a seller of stocks moving her money to cash and awaiting a chance to return. But they always ignore that this seller sold to somebody, who presumably moved a precisely equal amount of cash off the sidelines.”
Every transaction in the market requires both a buyer and a seller with the only differentiating factor being at what PRICE the transaction occurs. Since this is required for there to be equilibrium in the markets, there can be no “sidelines.”
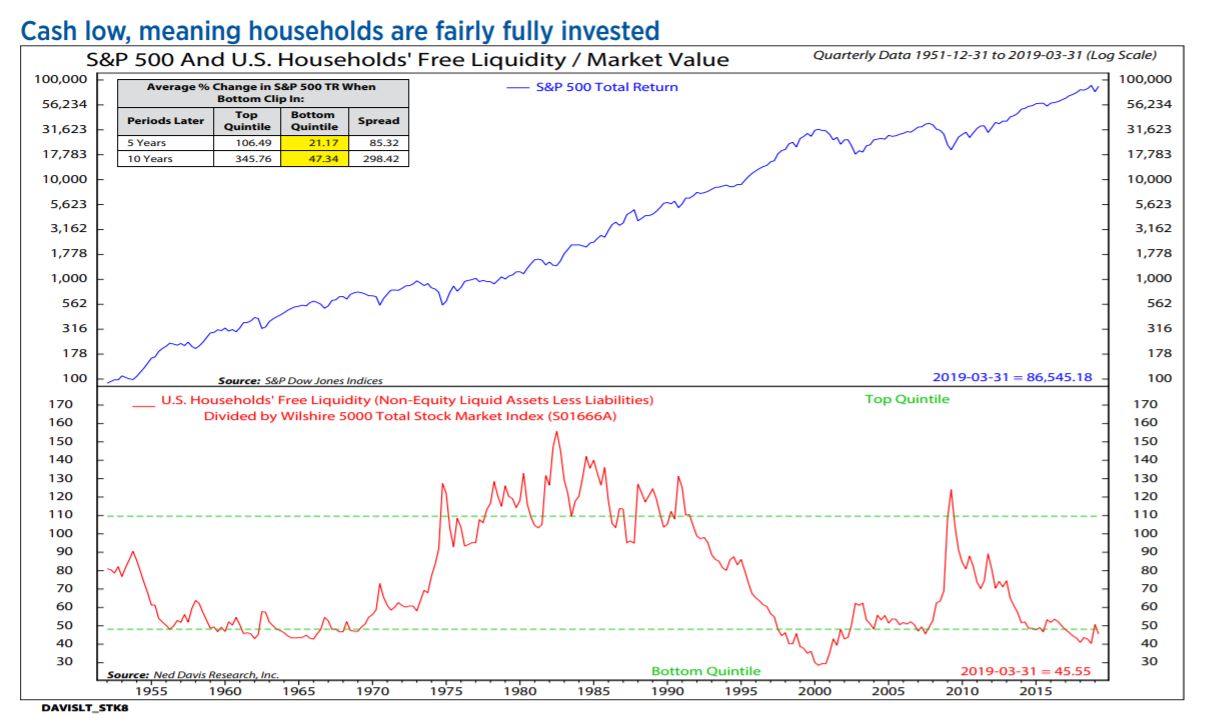
Furthermore, despite this very salient point, a look at the stock-to-cash ratios also suggest there is very little available buying power for investors current.
The reality is that investors remain more invested in riskier assets than has historically been the case. And, as Ned Davis noted:
“Cash is low, meaning households are fairly fully invested.”
Not A Bull In Sight
Lastly, our emailer suggests he can’t find a bull anywhere. It is only because he isn’t looking in the right places.
“Our full year GDP is on pace for 2.6%, which is stronger than the average annual GDP of this entire 10½ year expansion. Unemployment is near record lows. Consumer confidence is near record highs. And corporate earnings continue to impress.
None of that says recession.
But let me just play along for a moment and pretend that the inverted yield curve actually meant something this time around – the fact of the matter is that the economy often expands after an inversion, and the stock market goes up on average of double-digits afterwards.
If anything, the inverted yield curve is one of the best buy signals of all time.”– Kevin Matras, Zacks Research
Or, this:
“Despite recent recession fears and yield curve inversions, the bull market should live on until early 2021, analyst Tom McClellan said Thursday on CNBC’s ‘Closing Bell. ‘ Everyone needs to just keep their pants on for now and realize that the yield curve gives a really long early warning about trouble. It doesn’t say that trouble is upon us now. It takes several months to over a year before we get the final price high after a yield curve inversion. If you get an instance like 1995, there was a very momentary yield curve inversion and then it backed off and the bull market kept on going. So that is possible.” – CNBC
You can’t get much more bullish than that.
However, as I wrote previously in “The Yield Curve Is Sending A Message:”
“While everybody is ‘freaking out’ over the ‘inversion,’ it is when the yield-curve ‘un-inverts’ that is the most important.
The chart below, shows that when the Fed is aggressively cutting rates, the yield curve un-inverts as the short-end of the curve falls faster than the long-end. (This is because money is leaving ‘risk’ to seek the absolute ‘safety’ of money markets, i.e. ‘market crash.’)”
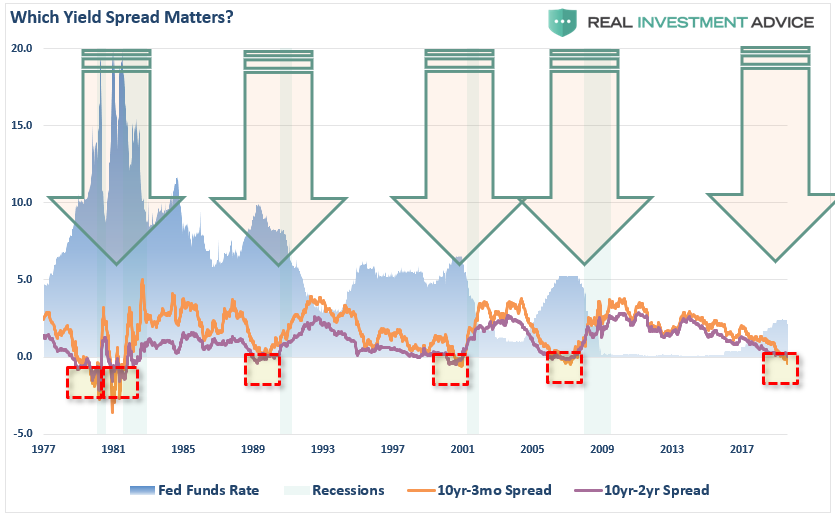
“As noted above, the current economic data is only a ‘guess’ about the current economy. In the next 12-months, we will see the ‘revised’ data, but the yield curve is already telling you it will be weaker.
Just as in December 2007, there was ‘no recession.’ It wasn’t until December 2008, when the data was revised, that the National Bureau of Economic Research (NBER) announced the recession had begun a full year earlier. In December 2007.”
Lastly, this isn’t 1995.
The Fed did cut rates in 1995 to fend off risks from the Orange County Bankruptcy, but the yield curve was nowhere near inversion. When The Fed begin seriously cutting rates, in 1999, as the yield curve inverted, well, I don’t need to remind you what happened next.
The Fed is cutting rates with the “yield curve” inverted.
I wouldn’t dismiss that too quickly.
Kevin Matras is correct. The stock market DOES indeed go up double digits following a yield curve inversion. The only issue is that it is the first step in recovering from the bear market that preceded it.
Market & Sector Analysis
Data Analysis Of The Market & Sectors For Traders
THE REAL 401k PLAN MANAGER
A Conservative Strategy For Long-Term Investors
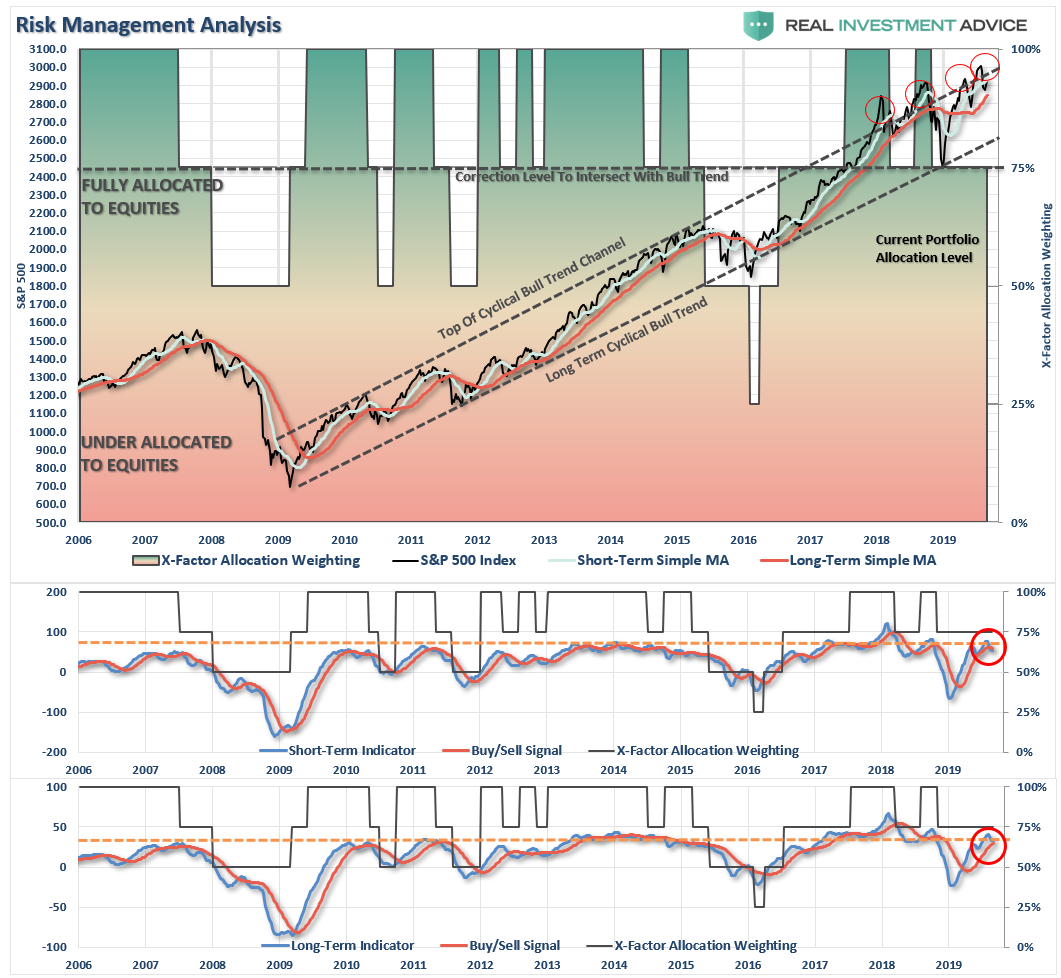
There are four steps to allocation changes based on 25% reduction increments. As noted in the chart above a 100% allocation level is equal to 60% stocks. I never advocate being 100% out of the market as it is far too difficult to reverse course when the market changes from a negative to a positive trend. Emotions keep us from taking the correct action.

More Volatility With No Direction
As noted above, more rhetoric on the “trade front” sent stocks running back to resistance last week only to fail. While the week posted a gain, the market still remains trapped within a very tight trading range below the 50-dma.
A break above that resistance will allow for a push back to all-time highs. A break to the downside will retest much lower levels very quickly. The risk/reward currently simply does not warrant taking on excessive risk until the market declares itself one way, or the other.
The economy is slowing down, and the underlying data suggests it is much weaker than headlines state. Corporate profits are also weakening, and there is a rising possibility that investors could begin to reprice valuations in the next month prior to the Fed meeting.
Speaking of “the Fed,” the war between the Fed and the White House continues unabated. With the Fed on deck in mid-September, there is a not-so-insignificant risk the markets could be disappointed by a failure to cut rates.
As noted last week, this is one of those times we have to sit on our hands and wait. With markets moving from one tweet to the next, it is impossible to successfully trade these swings.
However, note in the chart above, that both weekly “buy/sell” signals are close to triggering a “sell.” Also, not that each penetration above the long-term upper trend line has repeatedly failed. A confirmed “sell” signal at this juncture will require a further reduction in equity risk.
Downside risk is elevated, so we are maintaining underweight holdings for now. However, if we begin to break supports, we will recommend reducing risks further.
If you haven’t taken any actions as of late, it is not a bad time to do so.
- If you are overweight equities – Hold current positions but remain aware of the risk. Take some profits, and rebalance risk to some degree if you have not done so already.
- If you are underweight equities or at target – rebalance risks and hold positioning for now.
If you need help after reading the alert; do not hesitate to contact me.
Current 401-k Allocation Model
The 401k plan allocation plan below follows the K.I.S.S. principle. By keeping the allocation extremely simplified it allows for better control of the allocation and a closer tracking to the benchmark objective over time. (If you want to make it more complicated you can, however, statistics show that simply adding more funds does not increase performance to any great degree.)
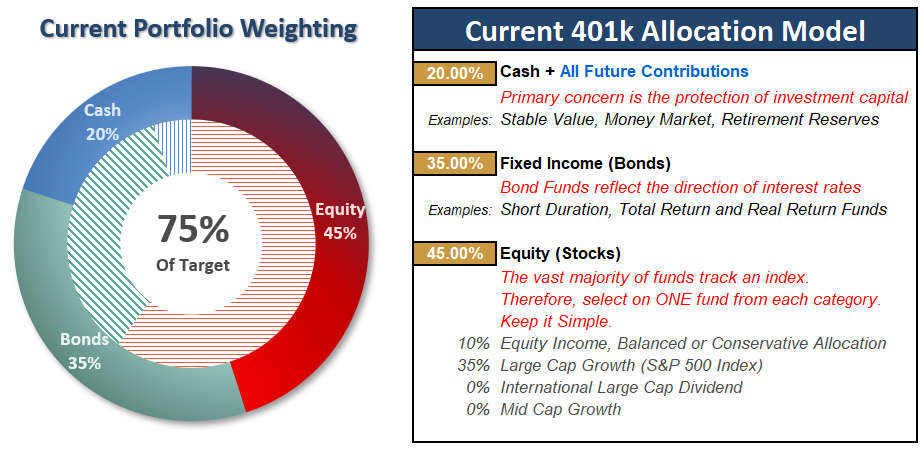
Model performance is based on a two-asset model of stocks and bonds relative to the weighting changes made each week in the newsletter. This is strictly for informational and educational purposes only and should not be relied upon for any reason. Past performance is not a guarantee of future results. Use at your own risk and peril.
Disclosure:
401k Plan Manager Beta Is Live
We have rolled out a very early beta launch to our RIA PRO subscribers
Be part of ...
more


It’s not all bad news, however. According to a Friday analysis by LPL Financial, the past 15 times that the S&P 500 lost ground in August, the rest of the year saw positive returns every single time.
Well that is good news!