Bond Market - What Is The Shape Of The Yield Curve Signaling For Cyclical Stocks?
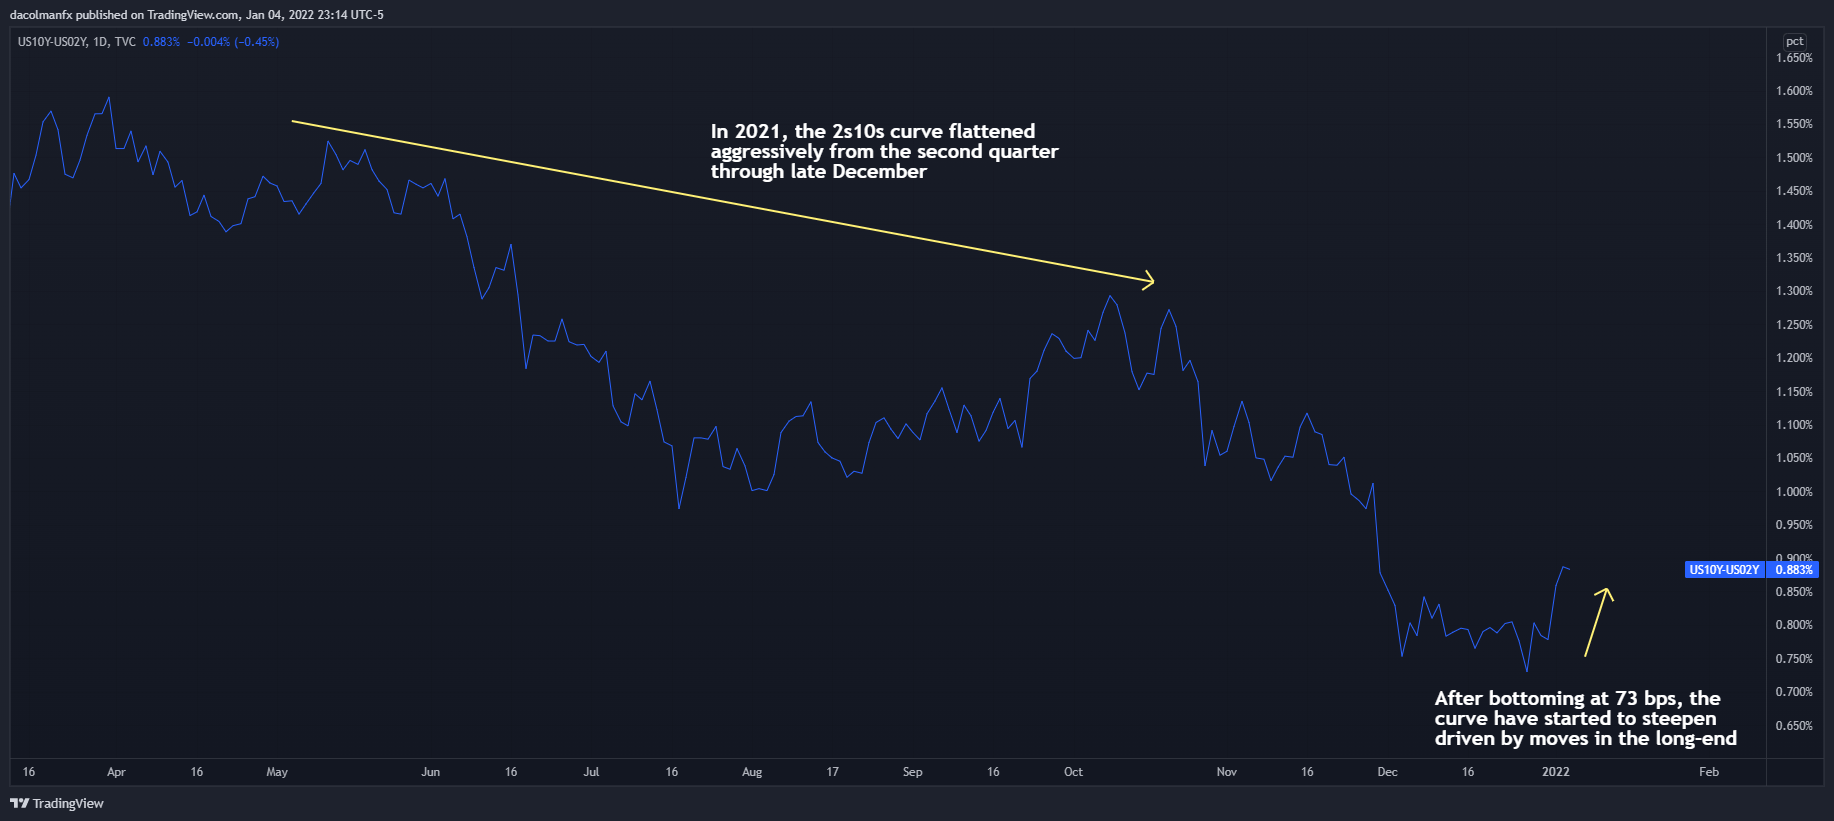
Last year, from the second quarter through late December, the U.S. Treasury curve flattened aggressively as investors began to price slower economic growth amid COVID-19 uncertainty and fading fiscal and monetary support. During this time, the 2s10s curve moved from 159bs to a low of 73bp, before rebounding towards 88bp this week (the 2s10s pronounced twos-tens is the difference between the 10-year Treasury Bond yield and the 2-year Treasury Note yield).
While some investors expect the flattening trend in the Treasury curve to resume and stay in 2022 reflecting the late stage of the business cycle, others believe the gap between long-term and short-term yields will widen at least for the next few months, supported by a solid recovery derived primarily from the end of the pandemic. Both theories are tenable, but it is worth noting that in the last several days, the 2s10s spread has increased, rising some 18bp on the back of a sharp jump in the 10-year yield amid waning coronavirus anxiety. Turning to the latter point, COVID-19 cases fueled by omicron have reached all-time highs after the holidays, but Wall Street is taking the information in stride as data indicate the new virus strain only causes mild diseaseand may be crowding out potentially more lethal variants, a scenario that would spell the end of the health crisis.
US YIELD CURVE (2S10S)
(Click on image to enlarge)

Source: TradingView
Returning to the yield curve, the recent steepening appears to be the result of expectations that the omicron will not derail the recovery, along with bets that the Fed will plow ahead with plans to withdraw stimulus to tackle inflationary pressures without making a policy error that undermines the expansion.
From the lens of the equity market, a steeper curve driven by moves in the long end is a strong cyclical signal as it implies investors are optimistic about the outlook for economic activity and reckon future inflation will remain elevated. It is too soon to make broad conclusions based on the twists and turns of the yield curve, but the current dynamics, if durable, are likely to be bullish for cyclical sectors (positive outlook for earnings amid above-trend GDP will also be bullish). Of this group, I personally like energy and financials as both plays are highly levered to the reopening of the economy.
To reduce the risk that may arise from poor stock picking, the bullish thesis on cyclicals can be played via sector ETFs. For energy, I am personally looking at XLE and XOP whereas for financials I’m watching XLF. These three ETFs are likely to command strength as we move through the first quarter and normality returns. In fact, they have already done well in the first days of the new year, with XLF up almost 4% and XLE and XOP up ~8% and ~11% respectively.
Disclaimer: See the full disclosure for DailyFX here.


