
A Significant Shift In Sentiment Was Seen

Image Source: Pixabay
It feels as though there was a significant shift in sentiment this past week. Before Wednesday's Fed meeting, market participants were fearful but also skeptical about what the Fed has said it wants to do with rates. However, by Friday, attitudes shifted and skepticism was gone when market participants realized that they are really doing this. I include myself in this group of market participants.
So, now what? It has been an awful market and the concern is that it may get even worse. We are in a bad time of the year for stock prices, and there is an important election about five weeks away. Market sentiment is very negative, to say the least.
However, the PMO has been at the bottom of the range for about four weeks, which is when I look for signs that the selling has become exhausted. I say, stick to the basic trading plan. When the market is beaten down, emotions are negative, and indicators are at the lows, it means that the best opportunity to sell has passed.
There might still be reasons to sell, such as seeing what was a well-performing position cut sharply below the 50-day on high volume, or a position that is too big and is keeping you up at night. But in general, now is the time to be watching the market signals for signs of the next rally because at some point soon there won't be any sellers left and the buyers will start to step in.

The bullish percents are getting close to the lows of June, which were extremely oversold levels and led to a meaningful counter-rally for stocks. With the bullish percents looking so negative like this, it is another reminder to watch for signs of a short-term bottom. My best guess is that these bullish percents will touch the June lows and then move sideways for a bit before starting to move up again.

This junk bond ETF showed a glimmer of hope for stocks by not closing below its June low. Watch this ETF. If it breaks down significantly, then stocks are going lower, too. However, if it somehow manages to hold above this level or if it doesn't sell off sharply, then it is a good sign.

The two stocks being most closely watched are Apple and Tesla. Apple is getting close to its uptrend after moving sideways for most of the year. The price is currently below the 30-week, which is a negative, but it is still well above the June low, which is a positive.

Tesla looks a tiny bit stronger than Apple, but it generally looks the same with price near the long-term uptrend line.

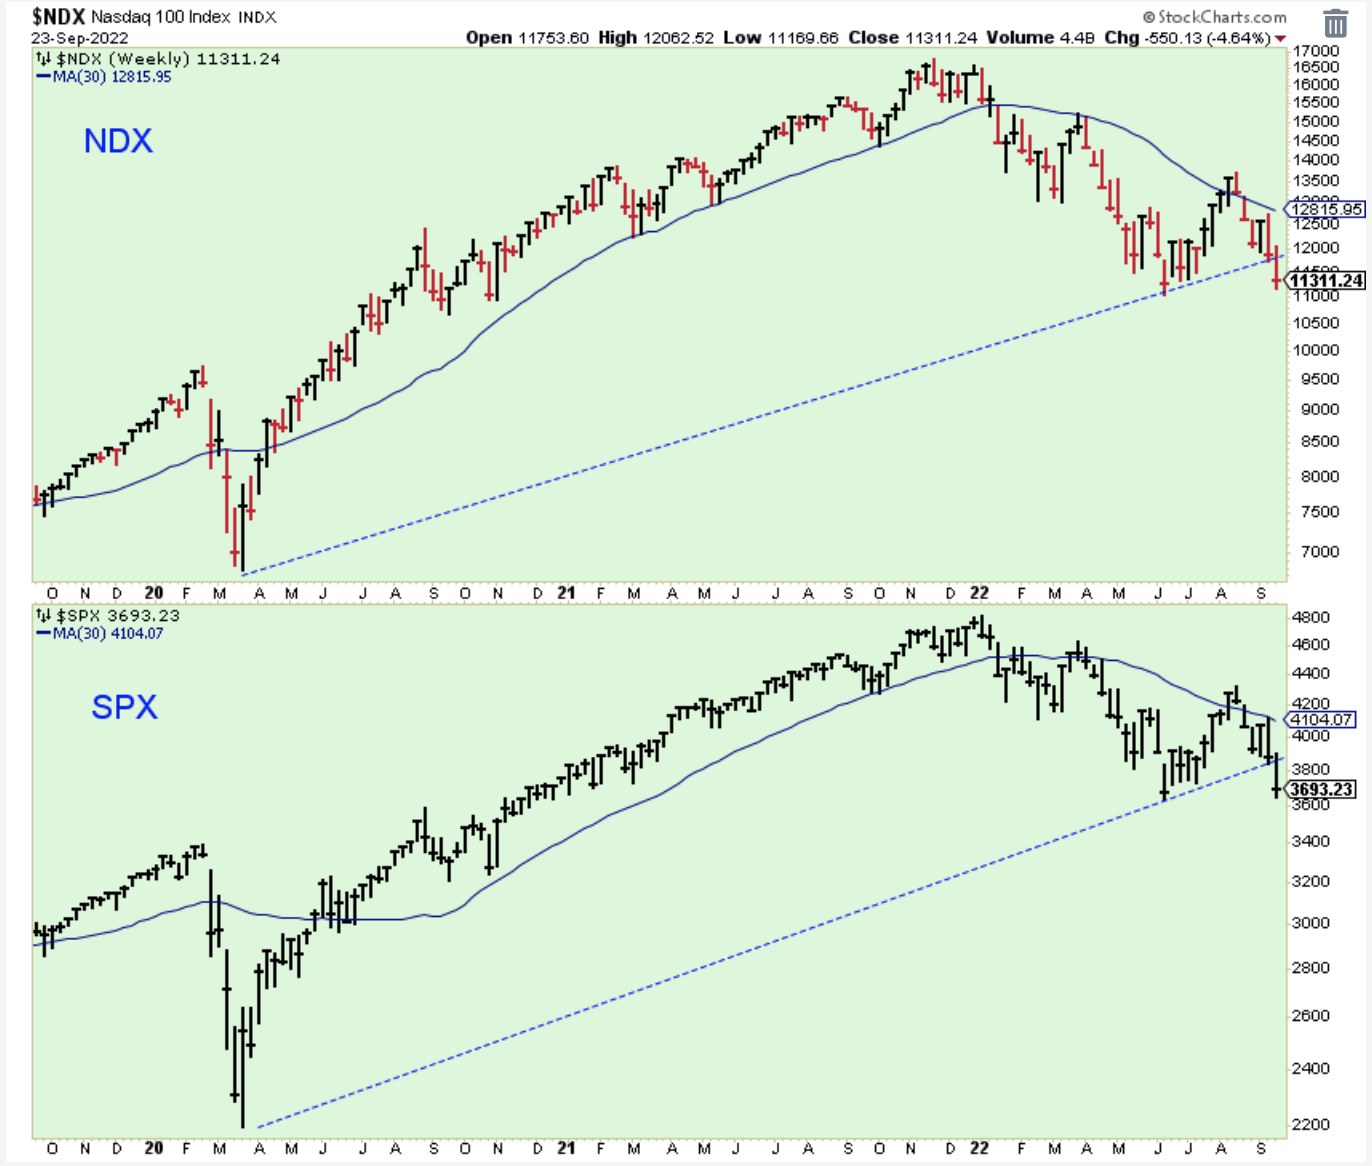
The two major stocks shown above may still be above their trendlines, but it looks like the two major indexes crossed below their trendlines, and now we must wait to see if they can hold the June lows. This doesn't look good.
People on CNBC continue to discuss the lack of volatility for the major indexes. The thinking is that a major bottom isn't established until these two volatility indicators spike close to the March and May highs.

The global Advance/Decline line is in a clear downtrend and hit new lows this week. A few weeks ago, the US AD line didn't look as bad as the global AD line, but now they are back in sync and the US line has also touched a new low.

Oil prices have been declining since June and showed continued weakness on Friday. Energy stocks have held up well despite this decline in the price of oil, but everyone knows that at some point weak oil prices will take down the stocks.

It looks like a decisive breakdown in the uptrend for energy stocks occurred on Friday. This ETF is now a short candidate, particularly if it rallies to close this gap and touches the underside of the trendline.

Bottom line: I performed fairly well in the market this past week by owning inverse 3x ETFs. After my poor performance during the August market rally, it felt good to make some money when I took profits and sold the ETFs on Friday. My alternate energy stocks were a disappointment, and most hit sell signals on Friday and I was stopped out of the positions. So at the moment, I am mostly in cash.
Here are some random but interesting charts.
This is a chart from John Murphy from several years ago. He discovered this correlation between the yen and gold miner prices. It isn't a perfect correlation, but it does look like the weak yen has pulled down the price of the miners when a lot of people thought they should be ready to rally higher.

More evidence of an oversold market can be seen with this chart.

These small-caps have to hold here near support or there is a lot of room to move lower.

The US dollar has blasted off. I heard someone say this week that there is no hope for a stock market bull until the dollar tops.

The second stage of the bear market begins when energy and the defensive sectors sell-off and enter downtrends along with the rest of the market sectors. I thought that happened in the June low when utilities sold off hard, but they surprised me and rallied back to new highs. I'm still watching though, and I like the chances that utilities may fall hard again soon.

I'm looking a bit foolish regarding bond prices. I thought that there was a chance that we had seen the bottom in prices (top in yields) for the 30-year Treasury bond. I'm still watching, though, because similar to the trend in utilities, when the 30-year bottoms, it helps mark stage 2 of the bear. Some people call these bear stages Denial and Acceptance.

Outlook Summary
- The short-term trend is down for stock prices as of Aug. 19.
- The economy is at risk of recession as of March 2022.
- The medium-term trend is lower for treasury bond prices as of Sept. 13.
More By This Author:
The August Downtrend Is Still IntactCaution Is Called For In This Short-Term Uptrend
The Short-Term Market Downtrend Continues
Disclaimer: I am not a registered investment adviser. My comments reflect my view of the market, and what I am doing with my accounts. The analysis is not a recommendation to buy, sell, ...
more

