
Are Market Expectations Of Inflation Really Rising?
A typical market-based measure of expected inflation is the inflation breakeven, calculated by subtracting the TIPS yield from Treasury yield at corresponding maturities. The breakeven spread is shown as the blue line in Figure 1.
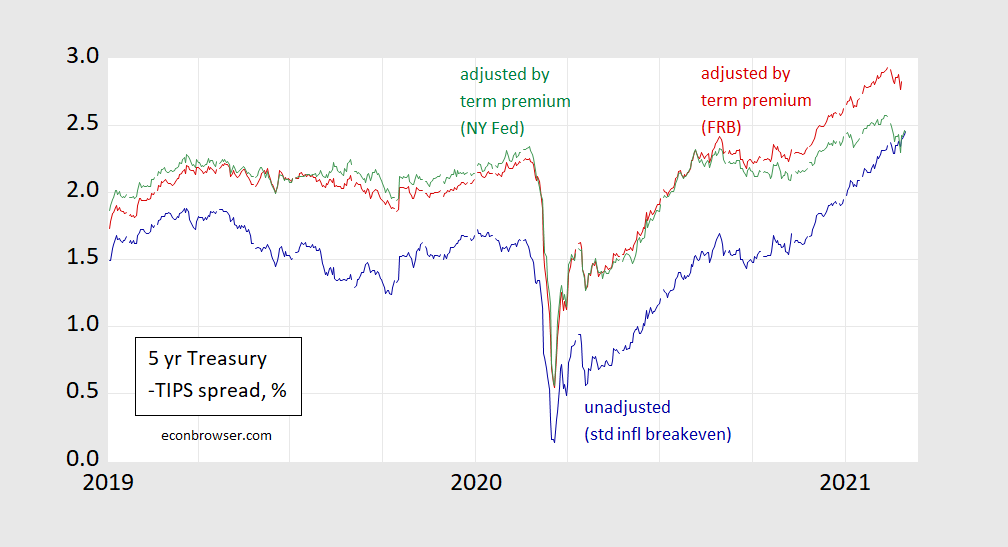
Figure 1. Five year inflation breakeven calculated at five year Treasury yield minus five year TIPS yield (blue), five year breakeven adjusted by Kim-Wright term premium (red), and adjusted by Adrian-Crump-Moench term premium (green), all in %. Source: FRB via FRED, NY Fed, and author’s calculations.
The breakeven series has clearly been on the rise. However, what does this series measure?
For the five year maturity, this spread is:

Where i is the nominal yield, r is the real (TIPS) yield, tp is the term premium due to inflation risk, and lp is the liquidity premium associated with the relative thinness of the TIPS market. Using the Fisherian relationship for nominal and real yields, we find the spread is:

Notice that only if the term premium and the liquidity premium move exactly together (or both are always zero) will the spread equal expected inflation. This point is stressed by Andreasen, Christensen and Riddell (2020), who show that the adjusted spread better predicts inflation. I don’t have estimates of the liquidity premium for 5 year TIPS, but I do have estimates of the term premium on 5 year Treasurys. The implied inflation rate holding at zero the liquidity premium is shown as red line (using the Fed’s Kim and Wright three factor model of the term premium) and green line (using the NY Fed’s Adrian, Crump and Moench five factor model).
While expected inflation is higher when adjusting for the term premium, the increase in the expected inflation is less: 60 bps (FRB) or 30 bps (NY Fed) vs. 90 bps (unadjusted spread). And the adjusted spread has been declining in the last two weeks (through 3/3).
Impounding what I have termed the liquidity premium into what Sirio Aramonte and Fernando Avalos call an inflation risk premium, they write:
In a simple textbook setting, the inflation risk premium would only reflect the compensation that investors demand for holding nominal Treasuries, over and above the compensation for expected inflation. In this case, the only drivers of the risk premium would be investors’ perceptions of risk and their risk appetite. In practice, however, the measured inflation risk premium can also reflect a variety of additional drivers. In the US case, these include imbalances between the demand for and supply of Treasuries and TIPS, or the relative liquidity of the underlying markets.
The net supply of Treasuries and TIPS to private investors stems from the interaction of US Treasury issuance patterns and Federal Reserve purchases. As the US central bank swiftly expanded its holdings of TIPS and Treasuries in response to the Covid-19 emergency, the corresponding bond amounts available to investors dropped substantially in the first quarter of 2020 (Graph D, centre panel). From mid-2020, however, issuance of Treasuries picked up, with auction sizes increasing by between 20% and more than 50% by the end of 2020, depending on the tenor. At the same time, the auction sizes of TIPS remained stable. Since the Federal Reserve maintained a relatively large and steady pace of purchases that somewhat exceeded TIPS issuance but not the expanded issuance of Treasuries, the amount of Treasuries available to investors recovered quickly (Graph D, right-hand panel, red line), while the corresponding TIPS volume stagnated (blue line).
This combination of higher supply of Treasuries and lower supply of TIPS is likely to have contributed to the higher measured inflation risk premium. To the extent that the appetite for inflation hedging remained constant or rose, which appears likely given the macroeconomic and policy backdrop, investors would bid down the yield on the limited amount of TIPS available. The relatively low liquidity of the TIPS market would amplify this effect. At the same time, investors would ask for an increasingly higher compensation to hold the quickly expanding amount of Treasuries. All these mechanisms would contribute to the rise of the break-even rate for given inflation expectations, thus boosting the measured inflation risk premium [emphasis added by MDC].
So, not only is it possible that expected inflation is less than the conventionally calculated inflation break-even (given the TIPS liquidity premium is likely positive), it might have been decreasing most recently (at least going through 3/3).
Disclosure: None.


