Are Factors Better And More Diversifying Than Asset Classes?
Factoring investing (intro here) is one of the hottest topics in investing today and one that we have studied and written about extensively. The promise is outperformance at low cost. Massive amounts of capital market data across stocks, bonds, commodities, currencies and other assets has been mined to show that rules such as “buy cheap stocks” (value) or “buy past winners” (momentum) have delivered risk-adjusted outperformance over time. There is now a so-called “zoo” of factors, most of which are not underpinned by a structural or behavioral reason why they should deliver positive returns in the future. In fact, many factors have already been discredited through out-of-sample tests and real-world experience. Even for the most tried and tested factors, like Value and Momentum, returns do not come easily as they can go through long periods of underperformance (10+ years). This is no different than owning a single asset class like stocks or bonds.
We aim to answer two questions in this thought piece:
- Should factors deliver higher risk-adjusted returns than asset classes?
- Are factors uniquely diversifying in a portfolio of multiple asset classes?
If factor returns can be expected to be better than those of asset classes and are more diversifying, then investors should hold a lot of exposure to these sources of return. If, on the other hand, factor returns are no better than asset classes, on a risk-adjusted basis, and also highly correlated, then they are at best substitutes for asset class exposure. If this were the case, one could simply leverage up the similar asset class, with lower complexity, and achieve the same portfolio effect as owning the factor exposure. In this article, we will explore these questions, specifically focused on the equity factors of Value, Momentum, Quality and Low Volatility.
Factors have delivered similar risk-adjusted performance as asset classes
Factor risk-adjusted returns similar to asset classes
All sources of return come with risk. Asset classes, like stocks and bonds, deliver a return in exchange for taking risk. Over time, they have delivered excess returns over cash in approximately 60% of annual periods. This translates into Sharpe ratios of around 0.3. Should factor strategies be better? The few fundamentally sound factors, like Value and Momentum, are based on behavioral biases, structural constraints, or risk transfers. There should be compensation over the long-term for assuming these risks. At the same time, factor strategies are quantitative, rules-based and transparent. This makes them relatively easy to implement, though not as reliably as buying and holding an asset class. We know that anything that is easily copied in investing should not produce exceptional risk-adjusted returns since markets are competitive and zero sum. Therefore, it is logical that, at best, factor strategies should deliver similar risk-adjusted returns as asset classes.
We use factor return histories from the Ken French data library to empirically show factor performance beside asset classes. Different methods for constructing factor portfolios will show slightly different results but we think this dataset is representative for the most common strategies. The table below summarizes the historical returns of 3 asset classes with histories back to 1970 beside the performance of the 4 most popular equity factors – Value, Momentum, Quality, and Low Volatility. All returns have been adjusted to 10% volatility. We can see that the factors delivered similar Sharpe ratios (risk-adjusted return) as the asset classes, mostly in a range from 0.3-0.4.

Source: Ken French Data Library, Bloomberg, Greenline Partners analysis. The results are hypothetical results and are NOT an indicator of future results and do NOT represent returns that any investor actually attained. Indexes are unmanaged, do not reflect management or trading fees, and one cannot invest directly in an index.
The risk with factors is that their results will be materially worse than the historical data show due to potential crowding. Some have discussed why this is not the case. We think the lack of consistency of factor returns, as we will show below, is enough to keep from crowding out returns entirely. But we also think it is only prudent and reasonable to expect the return premium from these strategies to be lower going forward as billions of dollars are now “exploiting” them.
Factor drawdowns similar to those of asset classes
Another way to show similar risk-adjusted performance of factors and asset classes is by looking at their historical drawdowns. The chart below compares the S&P 500 to the Value premium (both adjusted to 10% volatility). We can see both suffer 30+% drawdowns. This same pattern is true for all factors and asset classes and is characteristic of a return stream with a Sharpe ratio around 0.3.
(Click on image to enlarge)
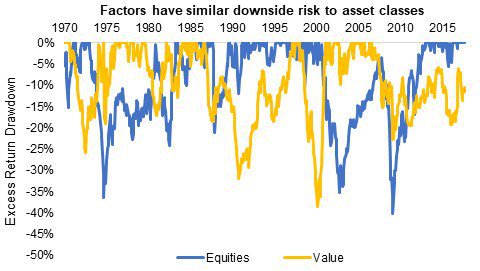
Source: Ken French Data Library, Bloomberg, Greenline Partners analysis. Data from Jan 1970-Sept 2017. The results are hypothetical results and are NOT an indicator of future results and do NOT represent returns that any investor actually attained. Indexes are unmanaged, do not reflect management or trading fees, and one cannot invest directly in an index.
In addition to drawdowns, we look at longer periods. All factors can go through many years of consecutive underperformance, just like asset classes. Below we compare the rolling 10-year returns of equities and the Value premium. We can see that both return streams have experienced multiple 10+ year periods without earning a return. Most investors are well aware of the lost decade for the S&P 500 from 2000-2009. Investors are less aware of the lost decade for Value from 2008-present as we can see from the yellow line.
(Click on image to enlarge)
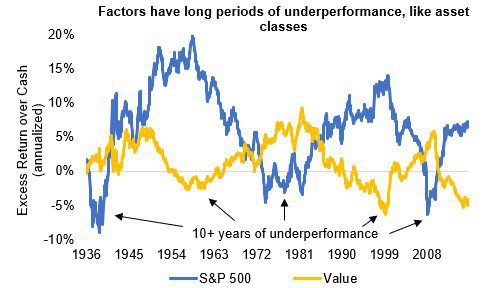
Source: Ken French Data Library, Bloomberg, Greenline Partners analysis. Data from Jan 1970-Sept 2017. The results are hypothetical results and are NOT an indicator of future results and do NOT represent returns that any investor actually attained. Indexes are unmanaged, do not reflect management or trading fees, and one cannot invest directly in an index.
In terms of risk-adjusted returns, factors are at best similar to asset classes. Therefore, one should not want a portfolio of factors over simply holding assets as both deliver similar returns. On the other hand, if factor strategies are uniquely diversifying to traditional asset classes, then they could improve diversification in a portfolio. The chart above shows returns from Value are diversifying to equities. But this is not true for all factors and leads to our next question of whether equity factors, broadly speaking, are uniquely diversifying compared to other asset classes, like bonds and commodities.
Most factors deliver returns at similar times as traditional assets like bonds and commodities
A source of return is useful in a portfolio if it is diversifying and/or can improve returns. One could lever up any diversifying return stream if they want to increase risk-adjusted returns, whether that return stream is an asset class or a factor strategy.
Factor strategies have been statistically uncorrelated to each other and asset classes. The table below shows the correlations of Value, Momentum, Quality, and Low Volatility factors to each other based on data from January 1970-Dec 2017. We can see the average cross-correlation is near zero. But this does not mean they are fundamentally uncorrelated to asset classes and therefore to most portfolios.

Source: Ken French Data Library, Bloomberg, Greenline Partners analysis. Data from Jan 1970-Sept 2017. The results are hypothetical results and are NOT an indicator of future results and do NOT represent returns that any investor actually attained. Indexes are unmanaged, do not reflect management or trading fees, and one cannot invest directly in an index.
Statistical correlations are unstable and not reliable for portfolio construction as all investors experienced most acutely in 2008. As is true with asset classes, the correlations of factor strategies to each other and to asset classes fluctuates wildly. Below is the rolling 3-year correlation for equity Momentum to the S&P 500. While the average correlation is slightly below 0, it fluctuates from -0.8 to almost +0.8 over time.
(Click on image to enlarge)
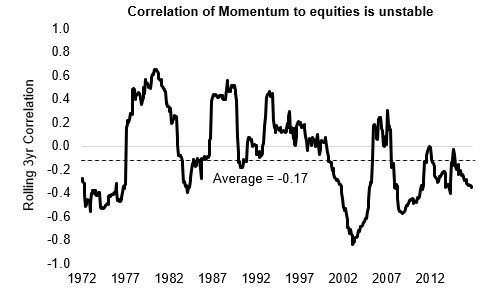
Source: Ken French Data Library, Bloomberg, Greenline Partners analysis. Data from Jan 1970-Sept 2017. The results are hypothetical results and are NOT an indicator of future results and do NOT represent returns that any investor actually attained. Indexes are unmanaged, do not reflect management or trading fees, and one cannot invest directly in an index.
We think scenario analysis is more useful for understanding when factors should be expected to perform well versus poorly. We use the growth/inflation framework here to assess similarities between factor returns and assets classes to see whether there is diversification power or not.
Sector tilts explain much of the environmental bias in equity factor returns
As we have discussed in past writings, asset class performance is reliable in different economic environments of rising/falling Growth and Inflation. That is, stocks tend to perform best when growth expectations are rising while bonds tend to perform poorly in these same environments. The appendix contains a refresher on this topic.
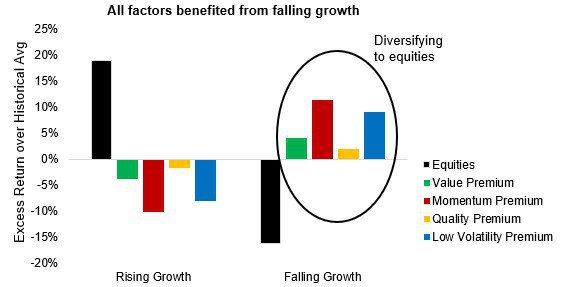
We think factor strategy returns are also biased to perform in certain environments for similar fundamental reasons. Some of the biases in factors are desired. For example, when Value outperforms the broad market during a drawdown by avoiding the most overvalued securities, this is desired. This pattern of performing well during the drawdown but trailing during the prior run-up in prices shows up as a bias to falling Growth (i.e. a recession) since this is the most common cause of stock prices falling.
Another reason for bias is persistent sector over- and underweights relative to broad indices. These sector tilts, on the other hand, are generally not desired because they should not be return enhancing. For example, in 2016 we wrote a paper on how low volatility strategies behaved like bonds because of their overweight to defensive sectors like Utilities and Food Staples. This overweight makes sense since sectors like Utilities and Food Staples have less earnings volatility and therefore lower price volatility as well. This persistent sector tilt causes Low Volatility strategies to outperform when rates are falling and underperform when rates are rising. The chart below shows the sector over- and underweights of this strategy relative to the market cap weighted S&P 500 index since 2011. We can see that a Low Volatility index is persistently overweight defensive sectors.
(Click on image to enlarge)
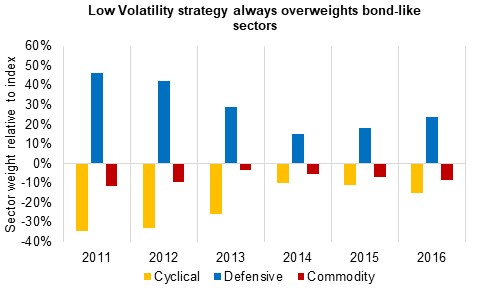
Cyclical sectors include Discretionary, Financials, Industrials, and Technology. Defensive sectors include Healthcare, Staples, Utilities and Telecom. Commodity sectors include Energy and Materials. Source: Bloomberg. Low Volatility index based on the SPLV ETF. Data from Jan 2011-Dec 2016. The results are hypothetical results and are NOT an indicator of future results and do NOT represent returns that any investor actually attained. Indexes are unmanaged, do not reflect management or trading fees, and one cannot invest directly in an index.
As another example, Value strategies tend to overweight businesses with large asset bases and therefore low price-to-book ratios like financials and energy companies. And businesses like energy companies tend to have high earnings volatility and therefore the market prices them with lower price-to-earnings ratios. Both energy and financials sectors tend to perform well with rising rates (rising growth with the former, and rising inflation with the later) resulting in a bias for Value strategies.
The charts below show the environments when each of these factors outperformed or underperformed the broad equity market. The first chart below splits history into periods of Rising versus Falling economic growth. See how all strategies outperformed together when Growth conditions were weakening. This bias is diversifying to equities and partly explained by these strategies avoiding the expensive and low-quality securities that tend to perform best in a bubble.
(Click on image to enlarge)
Source: Ken French Data Library, Greenline Partners analysis. Data from Jan 1970-Dec 2017. The results are hypothetical results and are NOT an indicator of future results and do NOT represent returns that any investor actually attained. Indexes are unmanaged, do not reflect management or trading fees, and one cannot invest directly in an index.
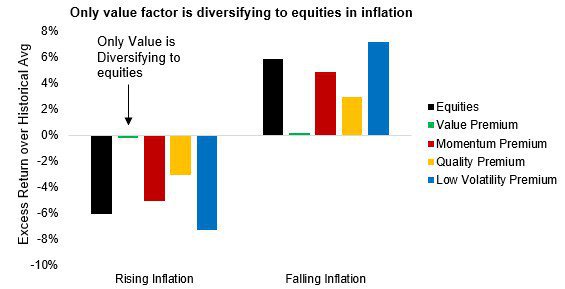
The next chart shows performance for the same factors, with history divided into periods of Rising versus Falling inflation. Here, all strategies except Value, outperformed when inflation was falling. Value was neutral to shifts in inflation and most diversifying to equities. This means Momentum, Quality, and Low Volatility are correlated to equities when inflation is the biggest driver of markets. Said another way, these same strategies have a bond-like nature and perform best with falling rates. For Low Volatility and Quality strategies, this should be less of a surprise since these strategies tend to overweight bond-like, defensive sectors.
(Click on image to enlarge)
Source: Ken French Data Library, Greenline Partners analysis. Data from Jul 1970-Dec 2017. The results are hypothetical results and are NOT an indicator of future results and do NOT represent returns that any investor actually attained. Indexes are unmanaged, do not reflect management or trading fees, and one cannot invest directly in an index.
Moving average momentum strategies: different strategy, but still similar to other assets over the long run.
Momentum is different from the other factors in that it is not sector tilts that drive when it performs best but rather the type of market environment, which is also connected to Growth and Inflation. As the name implies, Momentum aims to ride market trends and side step sustained losses in out-of-favor securities, sectors, and markets. But it is also well known that these strategies consistently miss market turning points.
To illustrate, we look at a moving average strategy applied to the US equities. This is admittedly different from the Momentum strategy applied to individual equities, but we show that these rules-based strategies, like the ones we analyzed above, also have economic biases that make them correlated to holding asset classes.
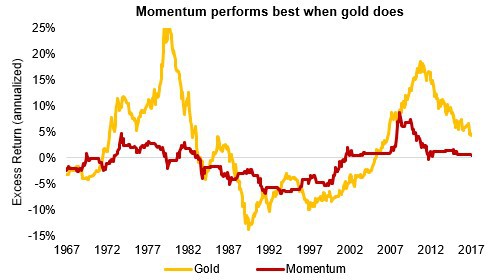
We know equities tend to drawdown during either falling Growth (recessionary environment) or rising Inflation environments. An asset that performs best in both of these environments is gold. To see how similar both are, we simulate a 10-month moving average strategy applied to the S&P 500 where the strategy sits in cash when the index is below this moving average. The chart below shows the rolling 10-year outperformance for a 10-month moving average strategy applied to the S&P 500 compared to gold. Both strategies deliver performance at the same time, over longer periods.
(Click on image to enlarge)
Source: Bloomberg, Greenline Partners analysis. Data from Jul 1928-Dec 2017. The results are hypothetical results and are NOT an indicator of future results and do NOT represent returns that any investor actually attained. Indexes are unmanaged, do not reflect management or trading fees, and one cannot invest directly in an index.
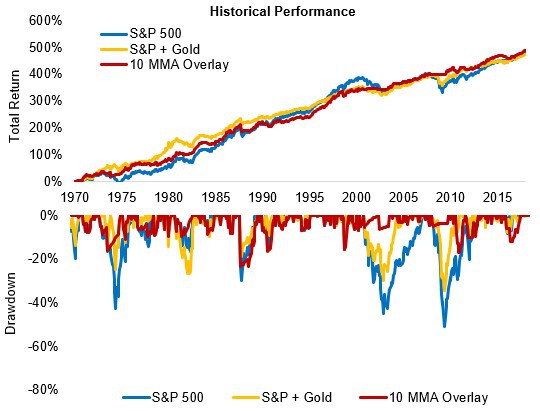
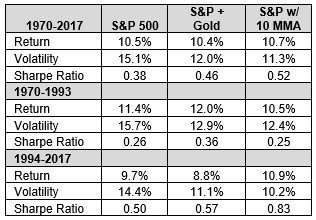
We also compare two portfolios using either a moving average strategy or gold. The first is the S&P 500 that moves into cash when the total return index falls below its 10-month moving average. And the second is a mix of 70% S&P 500 and 30% gold to target the same risk and return characteristics. We can see both portfolios have similar long-term performance. But the trend following strategy performed best since 2000 when there were multiple large market drawdowns but underperformed for the 25 years prior when there were fewer such events.
(Click on image to enlarge)
Source: (both figures above) Bloomberg, Greenline Partners analysis. Data from Jan 1970-Dec 2017. The results are hypothetical results and are NOT an indicator of future results and do NOT represent returns that any investor actually attained. Indexes are unmanaged, do not reflect management or trading fees, and one cannot invest directly in an index.
Both strategies look better than buying and holding the S&P 500 historically. But this period by period analysis makes us wonder whether the current popularity of momentum strategies is overly influenced by recent performance.
Expect multi-factor strategies to be no better than single asset classes
Single factor strategies can go through long stretches of underperformance as we have shown. Combining multiple, uncorrelated factors into a single portfolio is being done with the aim of delivering returns more consistently. But we have shown that many of these strategies have similar biases to economic environments. Momentum, Low Volatility, and Quality strategies have all performed best when bonds do well. Combining all of these factors together should create a portfolio that behaves like Treasury bonds.
To test this hypothesis, we simulated a multi-factor portfolio, equally risk-weighted to Value, Momentum, Quality, and Low Volatility equity strategies and targeting 10% portfolio volatility. The chart below shows the rolling 12-month returns for this portfolio compared to long duration Treasury bonds (roughly the same volatility). We can see that the multi-factor returns and Treasuries have a similar return pattern going back 25 years.
(Click on image to enlarge)

Source: Ken French Data Library, Greenline Partners analysis. The results are hypothetical results and are NOT an indicator of future results and do NOT represent returns that any investor actually attained. Indexes are unmanaged, do not reflect management or trading fees, and one cannot invest directly in an index.
This chart only goes back to 1993 in order to highlight the Dot.com period where most of the multi-factor outperformance was delivered. But the high correlation to Treasury bonds was true going back to the 1970’s as well. If we exclude 1999-2002 from the comparison, the return and risk statistics for the multi-factor strategy are almost identical to that of Treasury bonds, while being highly correlated as shown in the table below. The examples of simplicity beating complexity abound.

Source: Ken French Data Library, Bloomberg, Greenline Partners analysis. The results are hypothetical results and are NOT an indicator of future results and do NOT represent returns that any investor actually attained. Indexes are unmanaged, do not reflect management or trading fees, and one cannot invest directly in an index.
Remember, diversification has declining benefits with the addition of each additional return stream. As few as 3-5 lowly correlated return streams maximize the risk-adjusted returns for a portfolio. We would therefore not expect factor strategies to materially improve risk-adjusted returns in an already diversified portfolio since they are not fundamentally diversifying to the primary asset classes like bonds and commodities.
Also, note the frequent 20+% drawdowns for the multi-factor portfolio. Given the amount of leverage used (approximately 7:1 in our simulation), these periods could have led to blowing up and irrecoverable loss. We have found some existing products that exhibit this high correlation to buying and holding asset classes. As the assets going into these leveraged multi-factor strategies increases, we think the risk of blow-ups also increases.
Conclusions
The key to factor investing is identifying sources of lasting positive risk-adjusted return, with low correlation to traditional asset classes. Most factors are discovered through data mining and will not pass these tests. Even the soundest ones, like Value and Momentum, we think offer an only small opportunity for improvement in an already diversified portfolio.
We showed that the most popular equity factors of Value, Momentum, Quality and Low Volatility, delivered risk-adjusted returns only similar to that of asset classes, not better. And importantly, these returns were delivered at similar times as diversifying asset classes such as bonds and commodities like gold. For example, investors who have been positioning their portfolios for rising interest rates may be unknowingly adding a bond-like exposure by overweighting some of these factor exposures.
Investors would avoid most losses by keeping only two facts about markets in mind:
- Markets are zero-sum. For every winner there is a loser. That means not everyone can win. Investing in easily copied strategies, adopted by the masses, cannot provide easy outperformance by a wide margin.
- Making money consistently is the holy grail but one that has never been discovered. Any time such a feat is promised, investors should run the other way. Having a sound framework for diversification and staying disciplined with investing in quality assets at an appropriate valuation are about the best one can do to improve consistency.
Knowing what you own is critical to investing success. The abstraction of factors makes them more difficult to understand and see their role in the context of a total portfolio. Scenario analysis is a powerful tool in assessing any investment, whether an individual security or asset class. From our view, most factor exposures should be of little benefit to an already diversified portfolio of stocks, bonds, and inflation-protecting assets. In our goal of separating signal from noise, most factor talk sounds like pure noise.
Join thousands of other readers and subscribe to our blog.
Disclaimer: Please remember that past performance is not an indicator of ...
more


