
Summary
- Successful investment performance should consider economic trends.
- The performance of the 11 sectors of the S&P 500 and bonds is sensitive to changes in the growth of the economy.
- The business cycle is a useful tool to select the best-performing ones.
This article focuses on the performance of the eleven S&P 500 sectors and bonds during three business cycles as measured by the Peter Dag business cycle indicator - updated in each issue of The Peter Dag Portfolio Strategy and Management.
Will the Fed raise interest rates? What about the response of OPEC to lower oil prices? Which form of energy will be preferred by the new Administration? The money supply is soaring - it must have an impact on inflation, interest rates, and economic growth. The wars around the world also create a sense of uncertainty. Of course, there is China with its powerful navy and global ambitions. Nuclear wars are always a risk with Iran flexing its muscle. The market may be in a bubble fueled by stimulus and excessive debt.
These are all important issues. It is difficult to deal with them and develop a proven and reliable investment strategy. It is hard to quantify their impact on markets on a weekly or monthly basis. Yet, there is a group of individuals - the business decision makers - that filters these events, looks at market conditions, at the domestic and international competition, and makes business decisions on a daily basis to maximize the performance of their enterprise.
They must produce the goods consumers need. They must have inventories ready on the shelves in the right quantity to make a profit. This is the bottom line.
If inventories are too excessive compared to sales, production must be cut to safeguard earnings. If inventories are too low compared to sales, production must increase to re-stock inventories, and improve sales and profits. In the first case business slows down. In the second case business improves.
This seesaw in business decision making has a major effect on the business cycle. This seemingly simple inventory adjustment drives most asset prices.
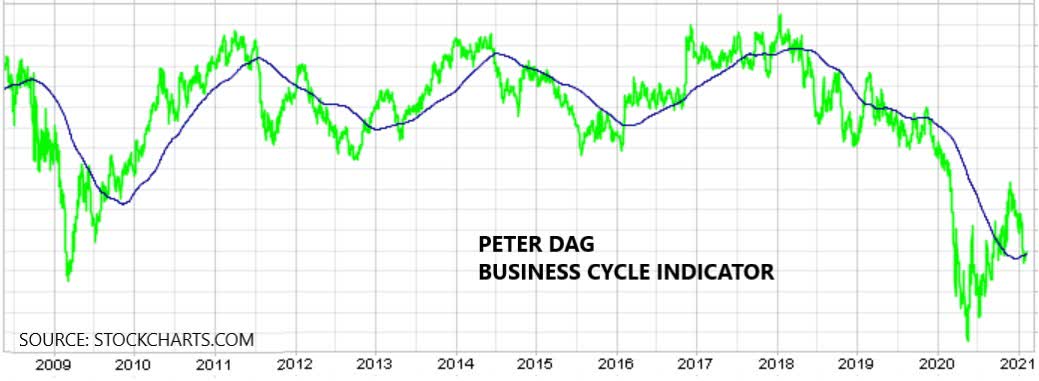
The above chart shows the graph of the business cycle made available to subscribers of The Peter Dag Portfolio Strategy and Management.
Since 2009 there have been three rising legs of the business cycle: 2009-2011, 2012-2014, and 2016-2018. There have been three periods when the business cycle declined: 2011-2012, 2014-2016, and 2018-2020.
The following charts show the returns of the eleven sectors of the S&P 500 and TLT (long-term Treasury bonds) during each of these periods as available from StockCharts.com.
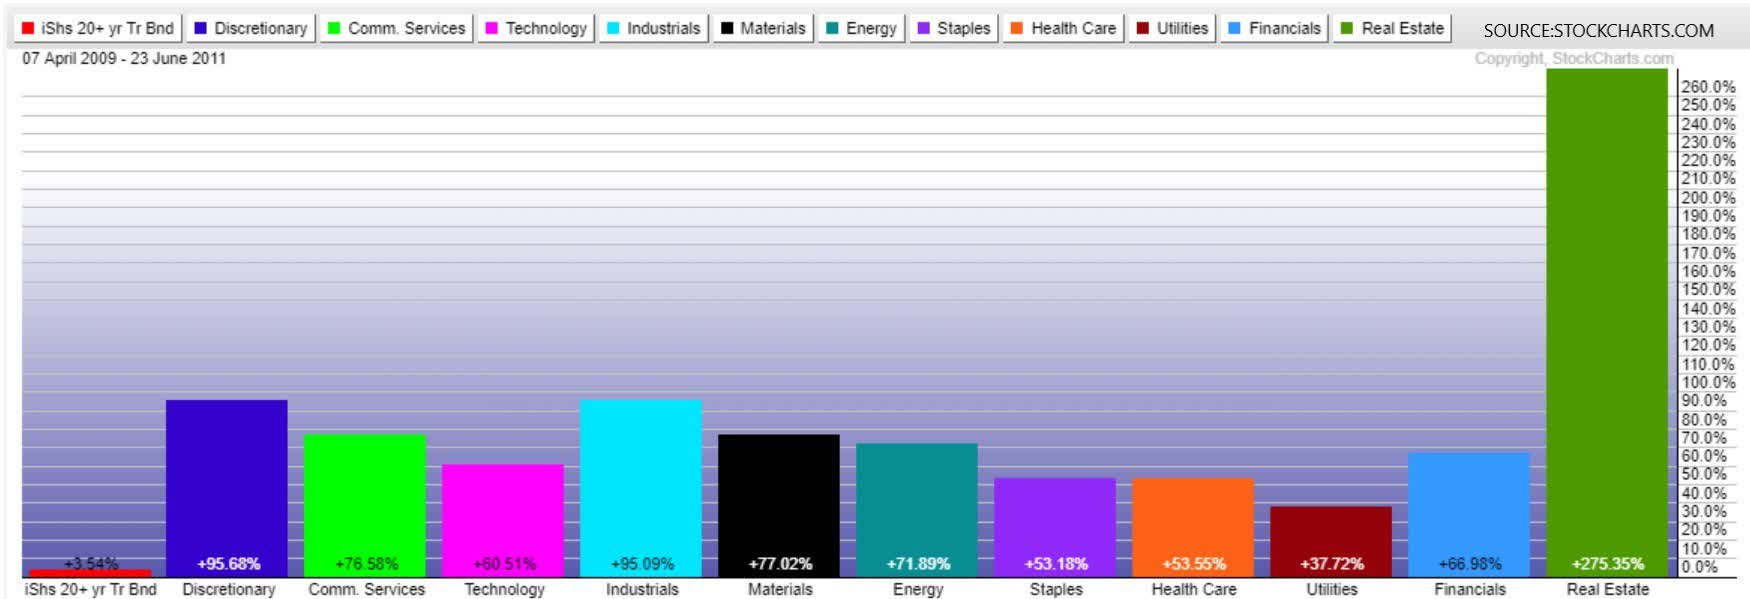
In the 2009-2011 upswing of the business cycle the strongest sectors were: real estate, discretionary, commercial services, technology, industrials, materials, financials, and energy. Staples, healthcare, utilities and TLT were the worst performers.
The main feature of the upswing in the business cycle was that all sectors rose. The sectors most sensitive to an improving economic environment were the best performers.
Performance, however, changed, as the business cycle declined, reflecting slower economic growth from 2011 to 2012.
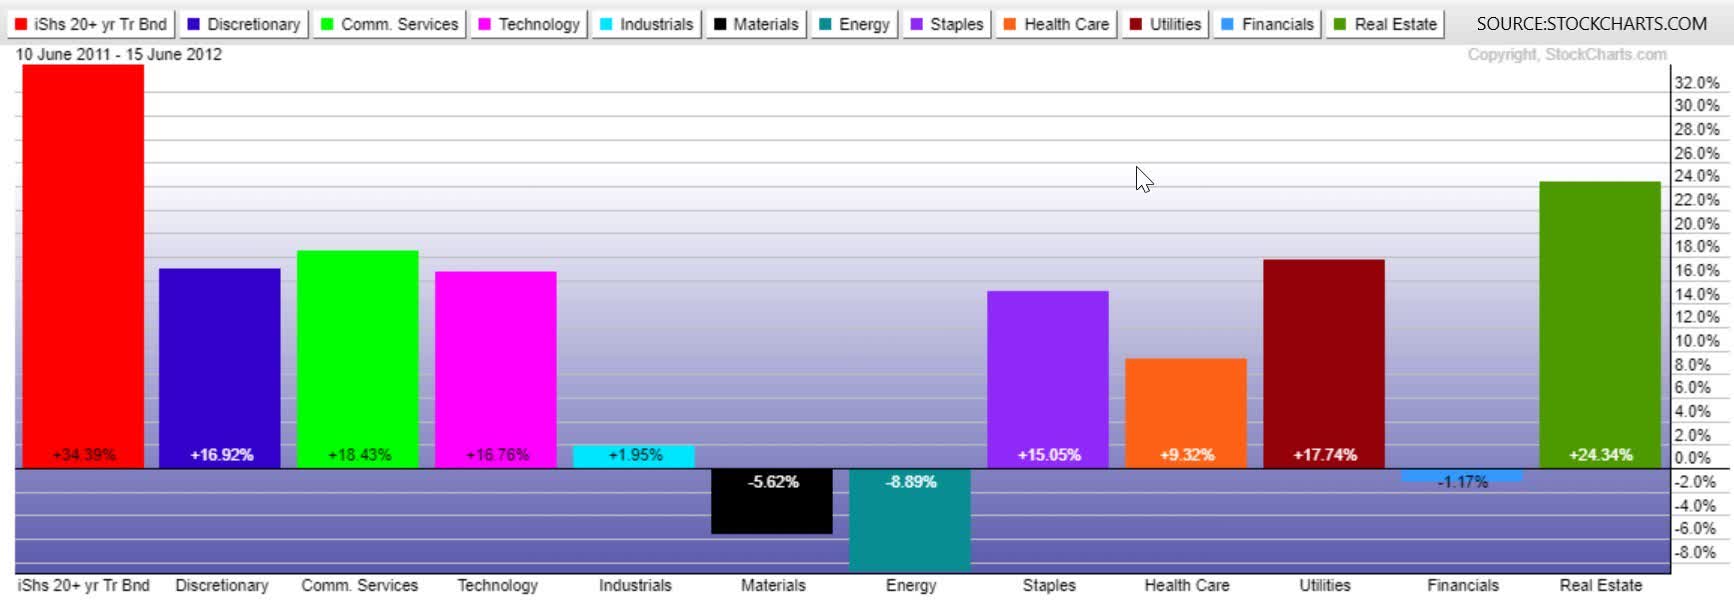
The above chart shows the performance of the 11 sectors of the S&P 500 and TLT from 2011 to 2012 - a period of economic slowdown.
The best performing positions were TLT, real estate, utilities, healthcare, and staples. Industrials, materials, and energy showed little or no gains. Technology, communications services, and discretionary continued to show good performance. The returns, however, were lower than those achieved during the previous rising leg of the business cycle.
Let us look now at the 2012-2014 period, characterized by stronger growth.
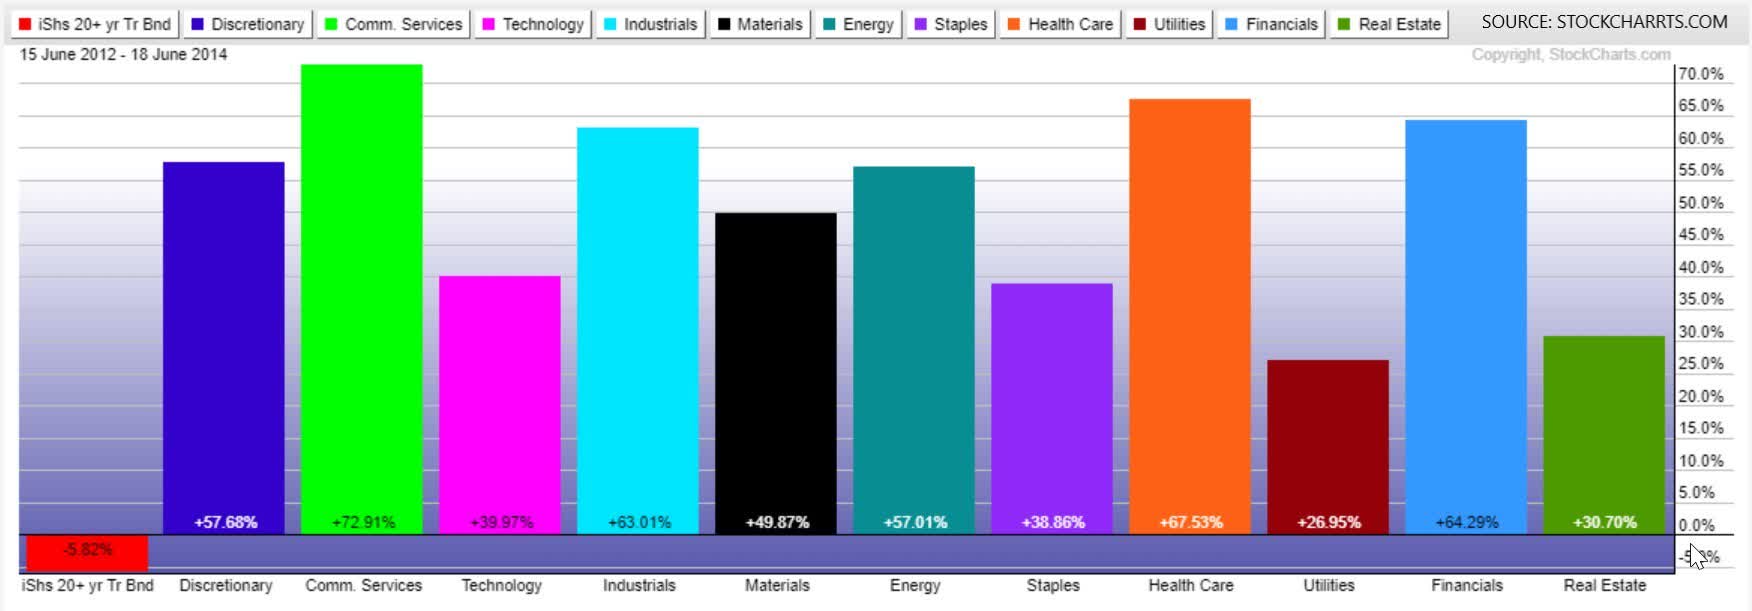
All sectors showed strong returns as in 2009-2011. Solid performance was exhibited by industrials, materials, financials, and energy. These were the sectors performing poorly during the downswing. Communication services, technology, and discretionary continued to show good performance, showing gains higher than those achieved during the previous down leg. Healthcare also was strong. Staples, utilities, real estate, and TLT underperformed.
The 2014-2016 phase of the business cycle -slowdown years - showed this performance.
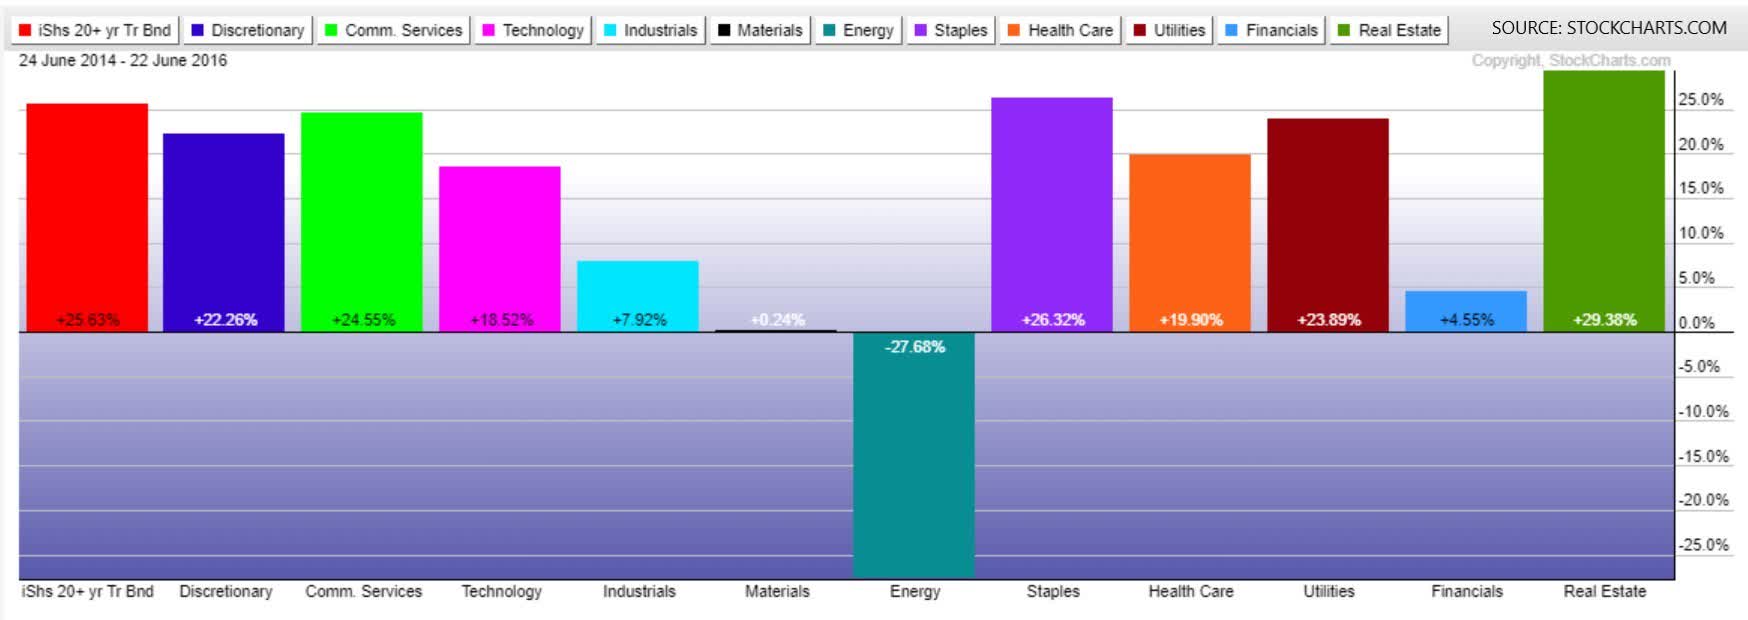
The sectors' behavior was like the one shown during the slowdown period of 2011-2012. The best performers were bonds, healthcare, staples, utilities, and real estate. Financials, energy, materials, and industrials were the losers. Discretionary, communication services, and technology continued to be strong but with gains lower than those achieved in the previous up leg. They underperformed TLT and real estate.
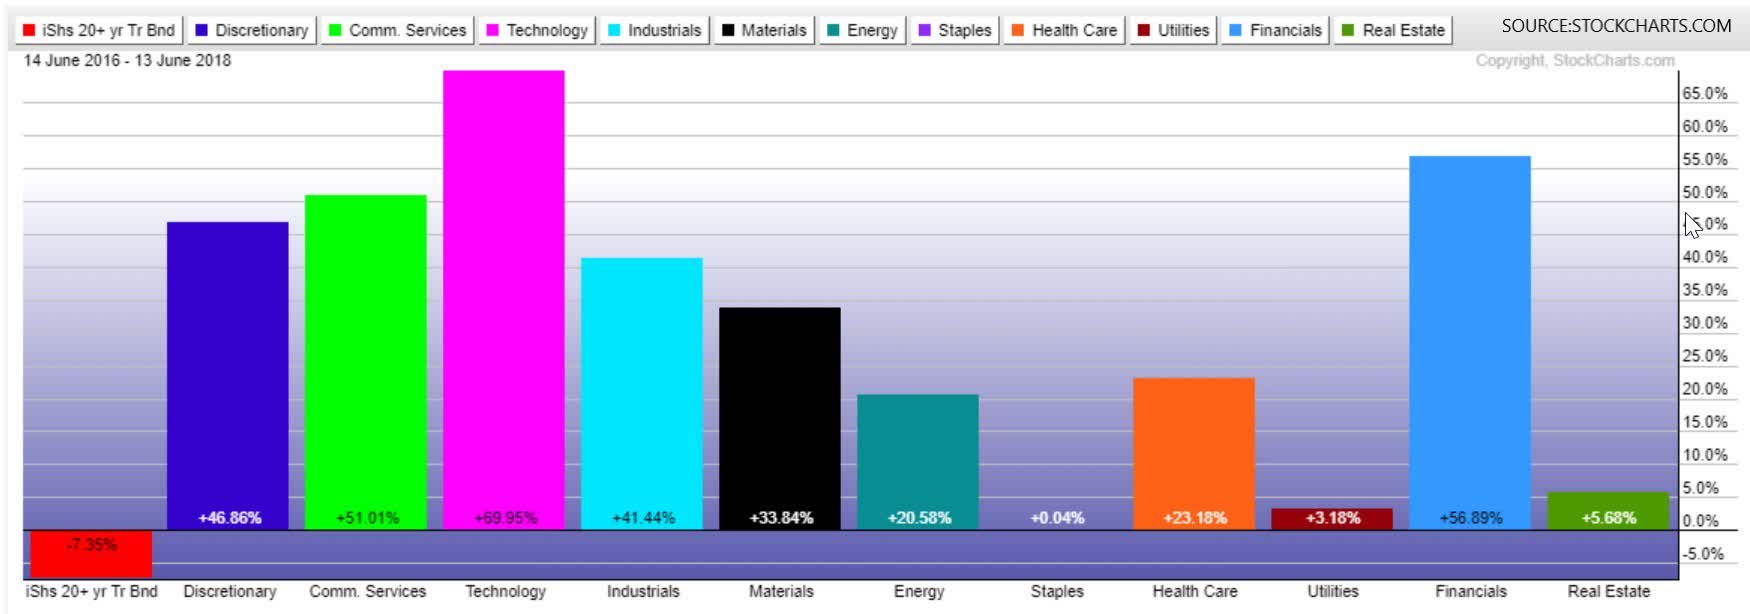
The rise of the business cycle indicator from 2016 to 2018 showed the weakest performers were staples, healthcare, utilities, and real estate. Bonds were the major losers in this leg of the business cycle. Strong performers were the industrials, materials, financials, and energy. Discretionary, communication services, and technology continued to display solid performance, showing their best performance in an improving business cycle environment.
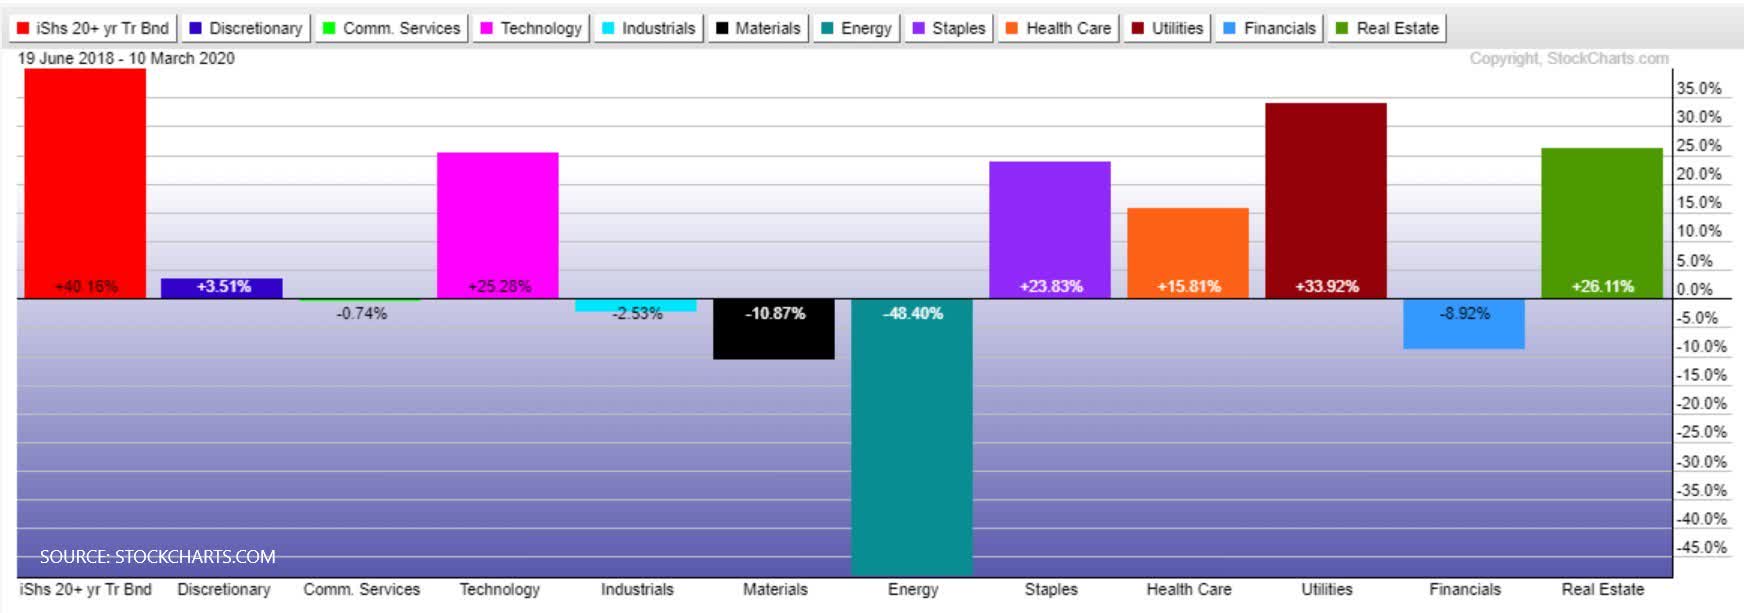
The economic slowdown started in 2018 and finished in March 2020, as reflected by the Peter Dag business cycle indicator.
The strongest sectors during these years were staples, healthcare, utilities, real estate. Bonds also performed well during this period. The sectors performing poorly were industrials, materials, energy, and financials. Technology stocks remained firm. Discretionary, communication services, and technology underperformed. Their returns were much lower than those achieved during the previous up leg.
Since March 2020, the business cycle began to rise, reflecting a strengthening economy. As of this writing (2/2/21), the performance chart of the 11 sectors plus TLT is shown below.
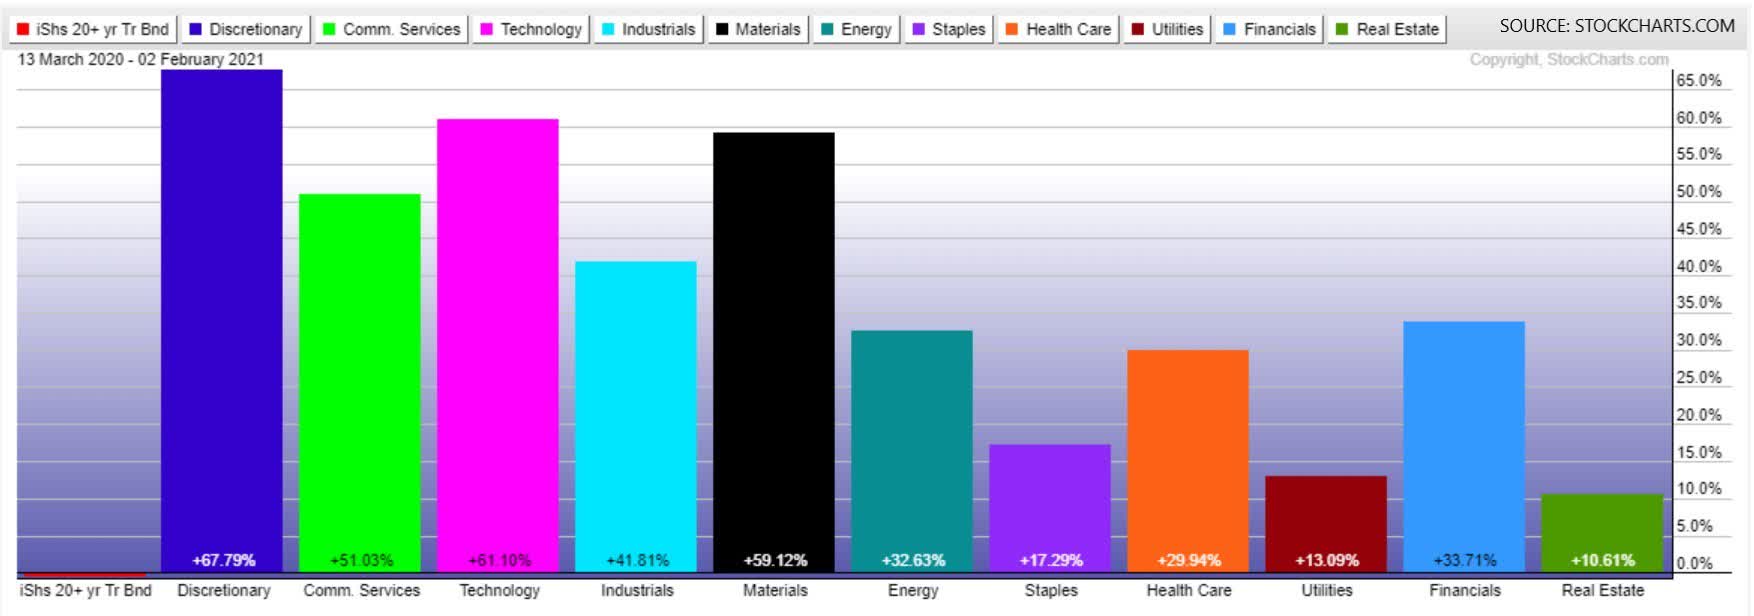
The strongest sectors during this period were industrials, materials, energy, and financials. The poor performers were staples, utilities, healthcare, and real estate. Bonds performed poorly in this period of stronger economic conditions. Discretionary, commercial services, and technology continued to perform well. Discretionary, communication services, and technology, as in previous cycles, continued to reflect superior performance in a rising cycle.
Investment Takeaways
The performance of the 11 sectors of the S&P 500 and TLT during the business cycles experienced since 2009 shows the following patterns.
1. In a period of stronger economic growth, reflected by a rising business cycle indicator, the strongest sectors were industrials (XLI), materials (XLB), energy (XLE), and financials (XLF).
2. When the business cycle declined, the best performing sectors were staples (XLP), utilities (XLU), healthcare (XLV), and long-term Treasury bonds (TLT).
3. The real estate sector (XLRE) was more attractive in a weakening economy.
4. Discretionary (XLY), commercial services (XLC), and technology (XLK) showed better performance when the business cycle indicator rose.
The point. The above analysis suggests a way to stay with the winners and avoid the losing sectors. For instance, beginning in 2020, when the economy came alive following the 2018-2010 slowdown, an investment portfolio should have emphasized discretionary, commercial services, technology, industrials, materials, energy, and financial stocks. The sectors to be avoided should have been healthcare, staples, utilities, real estate, and bonds.
>> Read More: Financial Markets Keep Swinging At The Rhythm Of History - Part 2


Comments
Log in or sign up to join the conversation.