

Image Source: Pexels
As DB's Henry Allen puts it succinctly, "2022 was an awful year for financial markets, with the S&P 500 seeing its worst annual performance since 2008, just as global bonds fell into a bear market for the first time in 70 years."
The biggest driver of this was much stronger-than-expected inflation, which hit multi-decade highs and led central banks to embark on their most aggressive tightening cycle in a generation. In the meantime, investors also had to grapple with geopolitical turmoil, since Russia’s invasion of Ukraine led to massive spikes in energy and food prices that particularly hit emerging market economies. That meant commodities were among the few assets that ended the year in positive territory. But elsewhere, the picture was far less rosy, and just 9 of the 38 non-currency assets in DB's sample made gains over 2022 as a whole, whilst in USD terms it was just 6 out of 38.
Year in Review – The high-level macro overview
The start of the year contained much of the themes that continued over the rest of 2022, with January seeing central banks pivot in a hawkish direction in response to continued and persistent inflation. For instance, investors initially expected the Fed to hike by just 74bps over 2022 as a whole, which was roughly in line with the FOMC dot plot from December 2021 that pointed to three 25bp hikes. But by the end of January, futures were pricing 123bps of hikes by year-end, with an initial rate hike widely expected for March.
That trend continued into early February, with growing speculation that the Fed might start the hiking cycle with a larger-than-usual 50bp hike. But by mid-February, there were growing warnings that Russia was about to invade Ukraine, which then occurred on February 24. That led commodity prices to surge, with Brent crude surpassing $100/bbl for the first time since 2014, before peaking at an intraday high for the year at $139/bbl on March 7. Other commodities also spiked, including European natural gas, and various agricultural goods such as wheat.
This rise in commodity prices created a fresh dilemma for central banks. On the one hand, they were unable to directly deal with the supply shock, but its consequences were being seen through higher inflation, creating the risk that inflation would become increasingly entrenched over time. With inflation concerns dominating the growth worries, the Fed began its hiking cycle in March with a 25bps move. However, on March 29 the US 2s10s yield curve inverted for the first time of this cycle, which was a concerning sign given that it had inverted prior to all of the last 10 US recessions.
By the end of Q1, markets had put in a pretty poor performance, but in Q2 it was even worse. Once again, the catalyst for this was stubbornly persistent inflation, and there was a massive slump in mid-June after the US CPI release for May came out. That showed inflation surprising to the upside yet again, which in turn prompted the Fed to ratchet up the pace of rate hikes to 75bps for the first time since the 1990s as they sought to get inflation back to target. The prospect of 75bp hikes triggered sizeable losses, with the S&P 500 falling by more than -10% in the space of a week, which was the first time that had happened since the pandemic turmoil of March 2020. At the same time, yields on 10yr Treasuries rose to 3.50%, their highest intraday level in over a decade.
Following the awful H1 performance, there were growing hopes by the summer that the Fed might soon begin pivoting in a dovish direction. Falling energy prices helped to boost that narrative, and the US CPI report for July showed the first monthly decline in prices since May 2020. But any hopes of that were firmly stamped out by a hawkish speech from Fed Chair Powell at Jackson Hole, where he said that getting back to price stability would “likely require maintaining a restrictive policy stance for some time.” The ECB also hiked rates for the first time in over a decade, opening with a 50bps move in July and following up with a 75bps move in September.
Another feature of Q3 was growing fears about a potential recession, particularly after the Nord Stream gas pipeline from Russia was suspended. At their peak, European natural gas futures rose above €300 per megawatt-hour, which ledEuropean governments to step in to protect consumers and businesses from the impact of higher energy prices. Later in the quarter, there was then a fresh bout of turmoil centred on the UK, after the government unveiled the biggest package of tax cuts in half a century. Sterling hit an all-time intraday low against the dollar and there was a large spike in gilt yields that prompted a Bank of England intervention. The turmoil did subside after the government U-turned on the bulk of the announcements, with Liz Truss succeeded as PM by Rishi Sunak. But even with the stabilization in Q4, gilts were still down -25.0% over 2022 as a whole.
This backdrop meant that Q4 started on a rough note, with the S&P 500 hitting its closing low for the year shortly afterwards on October 12. However, markets were more resilient after that as both the October and November CPI readings from the US surprised on the downside, leading to growing hopes that we might have finally seen “peak inflation”. That was echoed in the Euro Area too, where inflation fell from a peak of +10.6% in October to +10.1% in November. With inflation falling back, both the Fed and the ECB stepped down to 50bp hikes in December, but they remained hawkish in both cases, signalling further rate hikes ahead in 2023. The Bank of Japan also joined in the action right at the end of the year, announcing in a surprise move on December 20 that they were adjusting their yield curve control policy, with the 10yr yield now able to rise to 0.5%, having been limited to 0.25% before. However, even with the hawkish moves in December, Q4 still marked the only quarter of the year where markets had a broadly positive performance, with each of the S&P 500, the STOXX 600 and US Treasuries seeing a positive quarterly performance for the first time this year.
Which assets saw the biggest gains of 2022?
- Commodities: In a rough year more broadly, commodities were one of the few asset classes to post consistent gains in 2022. A big factor in that was Russia’s invasion of Ukraine, which led to a major spike in energy and food prices in Q1, which then unwound somewhat as the year went on. Nevertheless, Brent Crude (+10.5%) and WTI (+6.7%) still posted gains for the year, as did corn (+14.4%) and wheat (+2.8%) prices. For metals there was a more mixed performance however. Some such as platinum (+10.9%) performed very strongly, but gold (-0.3%) saw little movement and copper (-14.6%) posted its first annual decline since 2018.
- US Dollar: With the Fed hiking rates and moving faster than other central banks, the US Dollar was a major outperformer in 2022. The dollar index (+8.2%) posted its biggest annual advance since 2015, and the dollar itself strengthened against every other G10 currency over the year.
Which assets saw the biggest losses of 2022?
- Equities: An aggressive campaign of rate hikes and growing fears of a recession meant it was a rough year for equities. The S&P 500 (-18.1%) saw its biggest annual decline in total return terms since 2008, despite a +7.5% gain in Q4. Over in Europe, the STOXX 600 fell -9.9% over the year, and there was little respite in emerging markets either, with the MSCI EM index down -19.9%.
- Sovereign Bonds: After a multi-decade bull run, 2022 was an incredibly bad year for sovereign bonds. For instance, Bloomberg’s index of US Treasuries (-12.5%) posted its worst annual performance since data begins in 1973, and the iBoxx series was also down -12.9%. Longer-term data showed that it was the worst year for 10yr Treasuries on a total return basis since 1788. Euro sovereign bonds saw even larger declines, with a -18.4% decline thanks to losses in every single quarter, whilst gilts fell -25.0% amidst the turmoil in the UK.
- Credit: It was a very bad year for credit, with losses across all of the USD, EUR and GBP indices we follow. GBP credit saw some of the biggest declines, with GBP IG non-fin down -20.4%. However, high-yield credit was a relative outperformer across different regions, with EUR HY only down -10.6%, and US HY only down -10.7%.
- Cryptocurrencies: The risk-off moves more broadly proved bad news for cryptocurrencies, with Bitcoin down -64.3% to close the year at $16,540, having started the year at $46,334. This pattern was echoed among other cryptocurrencies, with Ethereum down -67.5%, Litecoin down -52.0%, and XRP down -58.7%.
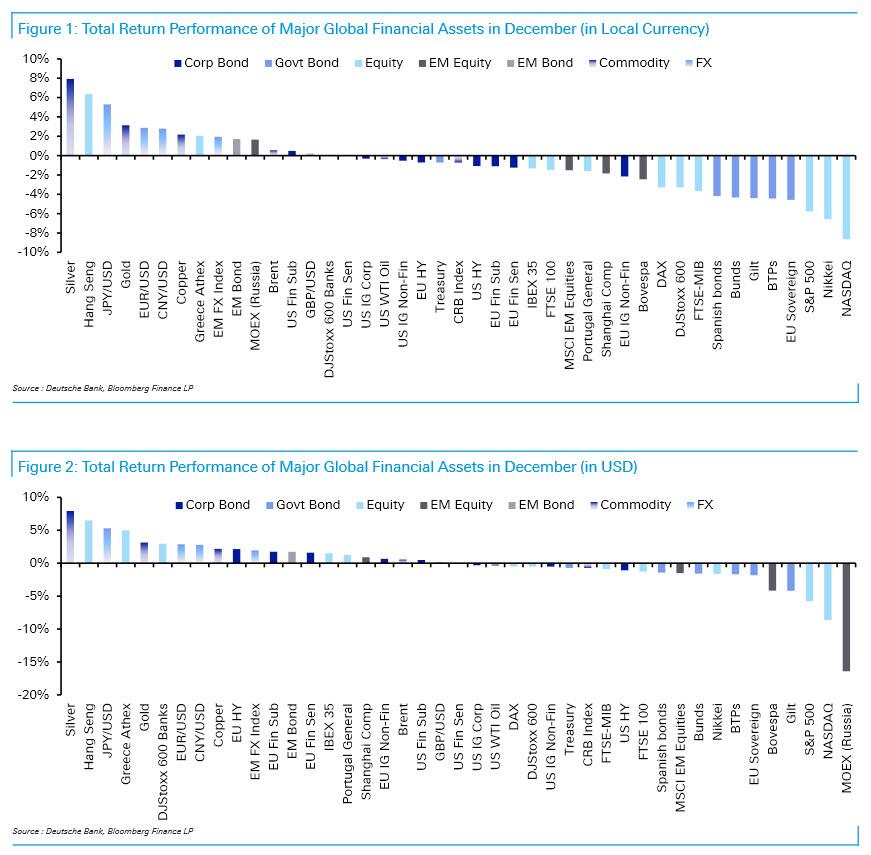
Best and worst performing assets in December (local currency and USD)
(Click on image to enlarge)
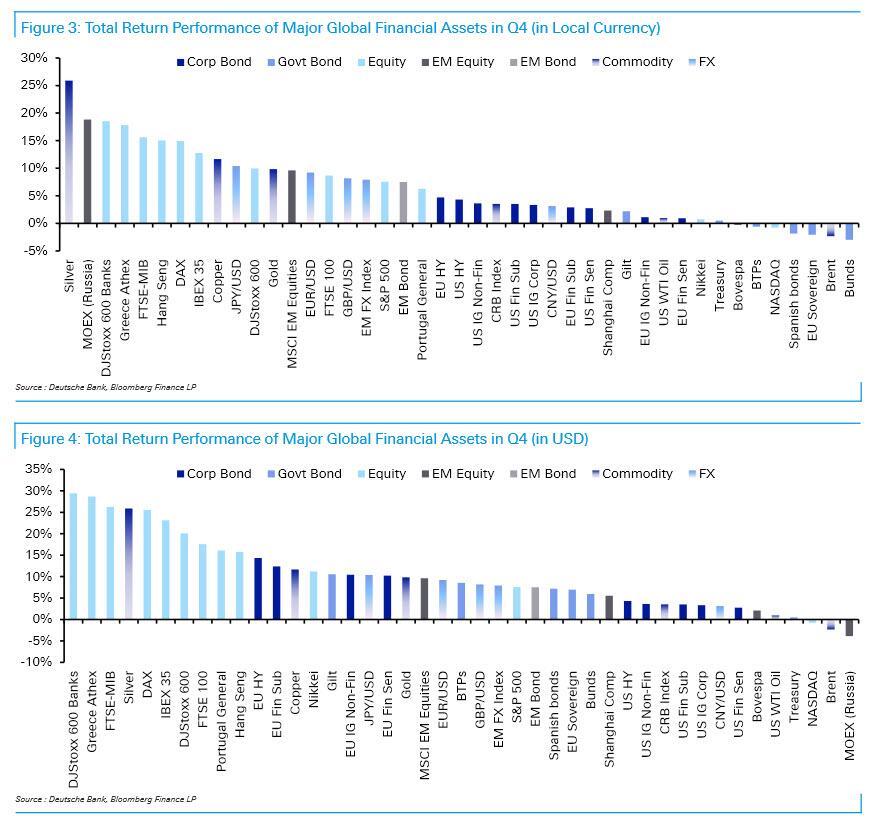
Best and worst performing assets in Q4 (local currency and USD)
(Click on image to enlarge)
Best and worst performing assets in 2022(local currency and USD)
(Click on image to enlarge)

More By This Author:
US Inflation: How Much Have Prices Increased In 2022?"Doom Cycle Of Default, Fraud, And Contagion" Could Give Way To Crypto Spring
Auto-Loan Rates From Credit Unions Are "Well Below" Rates Being Charged By Banks


Comments
Log in or sign up to join the conversation.