
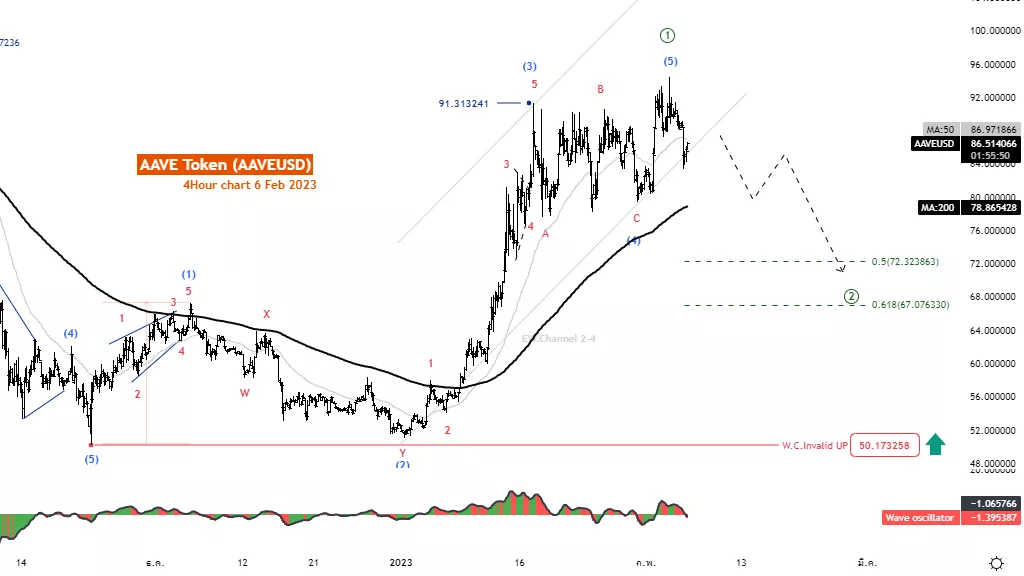
AAVE /U.S.dollar Trading Strategy: AAVE token has recovered well from the 50.40 level and managed to cross the MA200 line, indicating that an uptrend is forming. The Elliott Wave structure is in a correction of wave (2) as a short-term decline before the price rises again.
AAVEUSD Elliott Wave Technical Analysis
- Function: Counter trend
- Mode: Motive
- Structure: Impulse
- Position: Wave ((2))
- Direction Next higher Degrees: Wave III of Motive
- Wave Cancel invalid Level: 50.173
AAVE/USD Technical Indicators: The price is above the MA200 indicating an uptrend. The wave oscillators above Zero-Line momentum are bullish
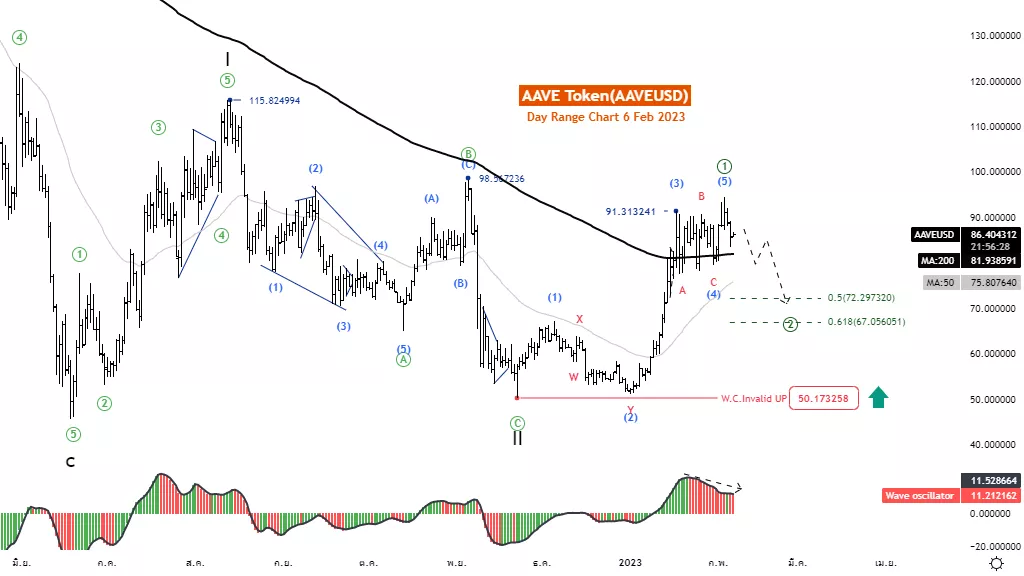
Trading Strategy: AAVE token has recovered well from the 50.40 level and managed to cross the MA200 line, indicating that an uptrend is forming. The Elliottwave structure is in a correction of wave (2) as a short-term decline before the price rises. again
More By This Author:
Elliott Wave Forecast: SP500, Nasdaq, Russell 2000, DJIA Show Bullish Momentum
Elliott Wave Technical Analysis: The Trade Desk Inc. - Friday, Feb. 3
Elliott Wave Technical Analysis: Polkadot / U.S. Dollar


Comments
Log in or sign up to join the conversation.