
Santa showed up with some more gifts in his bag this morning, in the form of a uniformly positive income and spending report for November.
Nominally income rose 0.4% in November. Nominal spending rose 0.3%. Although prices as measured by the PCE deflator actually declined -0.1% for the month, after rounding both real income and spending remained at the same levels. Since just before the pandemic real incomes are up 6.1%, and spending is up 9.8% (all graphs below normed to 100 as of February 2020 except as otherwise noted):
(Click on image to enlarge)

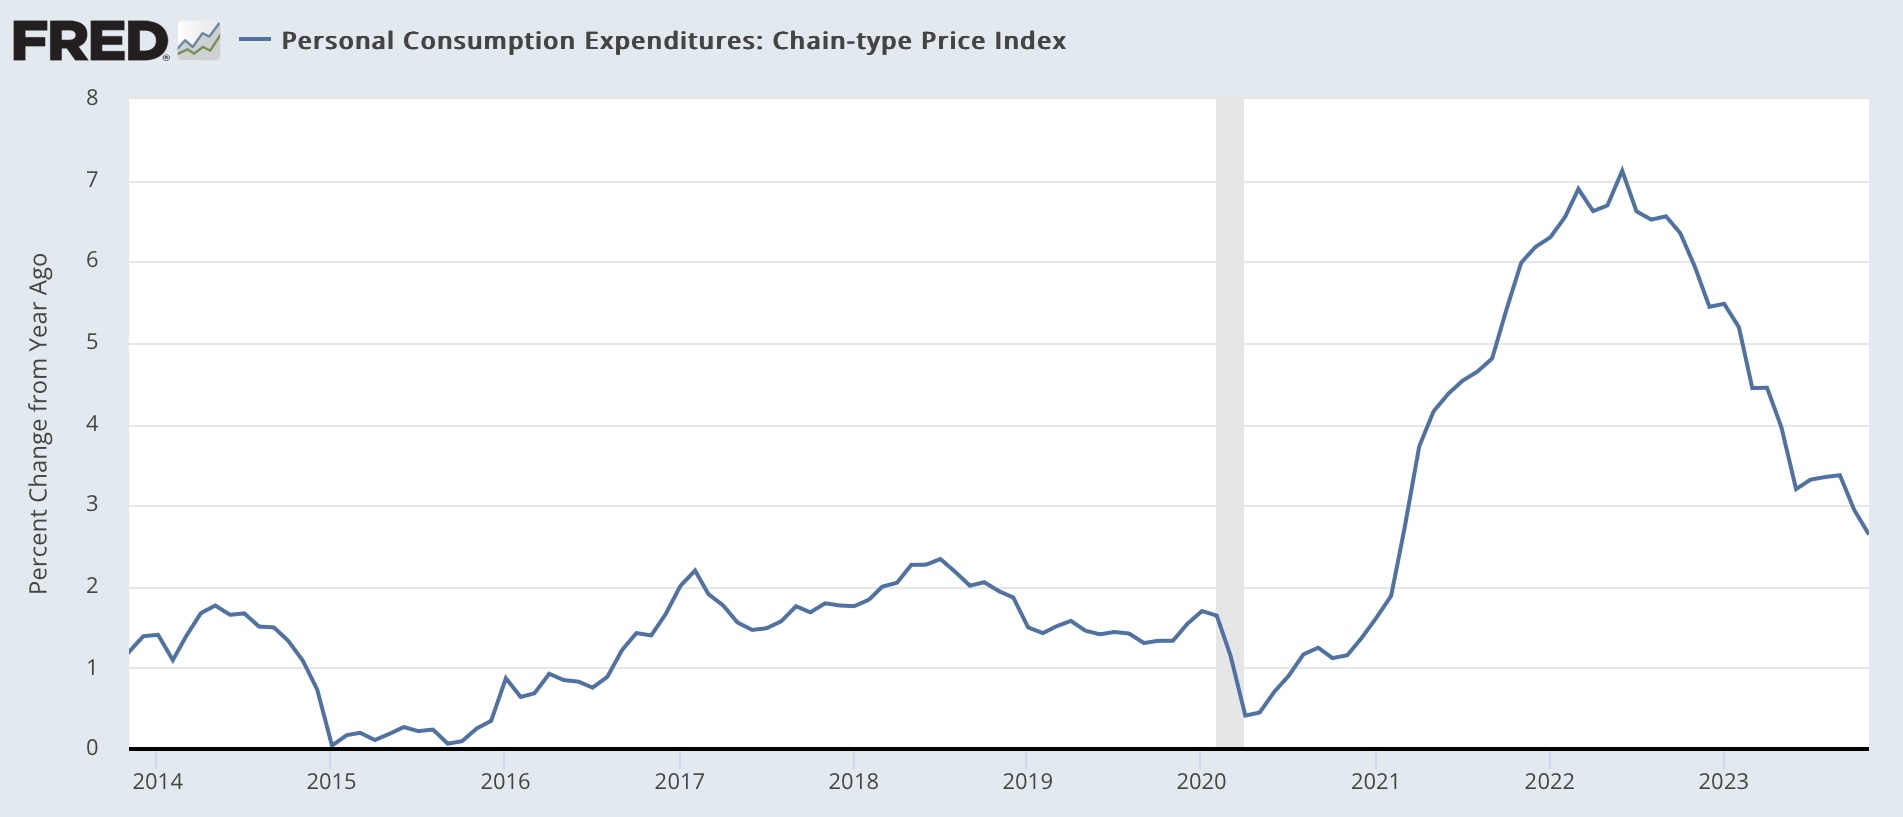
The decline in prices was only the first time since 2017, excluding the pandemic shutdown months of March and April 2020. On a YoY basis, the PCE price index is only up 2.6%, the lowest since February 2021, and almost back to the Fed’s target of 2.0%:
(Click on image to enlarge)
For the past 50+ years, real spending on services has generally increased even during recessions. It is real spending on goods which declines. Last month services spending rose 0.2%, and goods spending rose 0.9%:
(Click on image to enlarge)

As per form, real services spending has risen consistently since the pandemic, while goods spending have been somewhat of a mirror image of gas prices, which peaked in June 2022.
Since real durable goods spending tends to turn before non-durable goods spending, here is what they look like:
(Click on image to enlarge)

The former increased 0.9% for the month, while the latter increased 0.3%. Durable goods spending has been very much affected over the past several years by the shortage of new vehicle inventory, which has largely abated as this year has progressed.
Another important metric for the near future of the economy is the personal savings rate, which increased from 0.1% to 4.1%:
(Click on image to enlarge)

As I’ve noted for the past few months, this remains one of the lowest rates of savings ever. For comparison, here is the same metric from 2000 until just before the pandemic, including the lowest rates ever in 2005-07:
(Click on image to enlarge)

So, on the one hand, the 4.1% savings rate indicates consumer confidence. But it also indicates vulnerability to an adverse shock.
The NBER pays particular attention to several other aspects of this release. Real income excluding government transfers (like the 2020 and 2021 stimulus payments) continued to increase, up 0.6% for the month:
(Click on image to enlarge)

Once again, this has been something of a mirror image of gas prices, rising consistently since June 2022.
The only fly in the ointment wasn’t with income or spending at all, but rather real manufacturing and trade sales, which make use of the deflator. These declined -0.1% in November, but this does not distrurb the generally increasing trend since June 2022 as well:
(Click on image to enlarge)

This is a consumer economy that is doing very well. Inflation has turned relatively tame, and both incomes and spending are up substantially. As the shock of the big inflation of 2021-22 abates, it is no wonder that several measures of consumer confidence have improved in the past couple of months. For the moment, at least, you could call it a “Goldilocks” economy. A holly jolly holiday season indeed!
More By This Author:
A Holly Jolly Holiday Season For Initial Jobless ClaimsExisting Home Sales Try To Find A Bottom, While Severe Bifurcation With New Home Market Continues
Housing Under Construction Continues To Levitate


Comments
Log in or sign up to join the conversation.