A Graphical Primer To Interpreting The Sources Of Inflation In The COVID Era
We hear about lots of factors affecting both output and inflation in this COVID impacted period: demand induced overheating, supply shocks, supply chain disruptions, wage based inflation, unanchored expectations. Is there a way to interpret each of these channels, and disentangle the effects? Yes, and no.
Aggregate Demand-Aggregate Supply Diagrammatics
Consider an economy originally at short and medium run equilibrium, in periods 0 and 1.
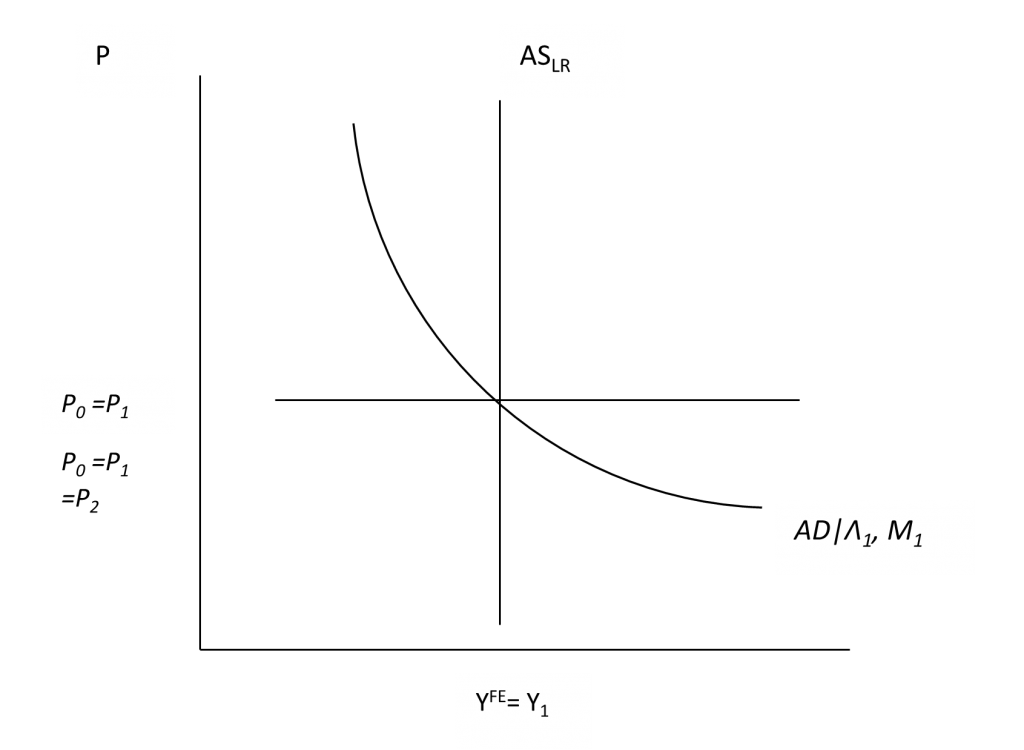
Figure 1: Initial short run and long run equilibrium in AD-AS, with no actual and expected inflation in period 0.
How does one interpret excessive monetary or fiscal stimulus leading to overheating and inflation – what used to be called “demand pull” inflation? That’s an outward shift in the AD curve in period 2 (dark gray arrow). Equilibrium moves as shown by the red arrow. In period 3, with a positive output gap in period 2, the price level rises (gray arrow) as equilibrium moves as shown by the blue arrow.
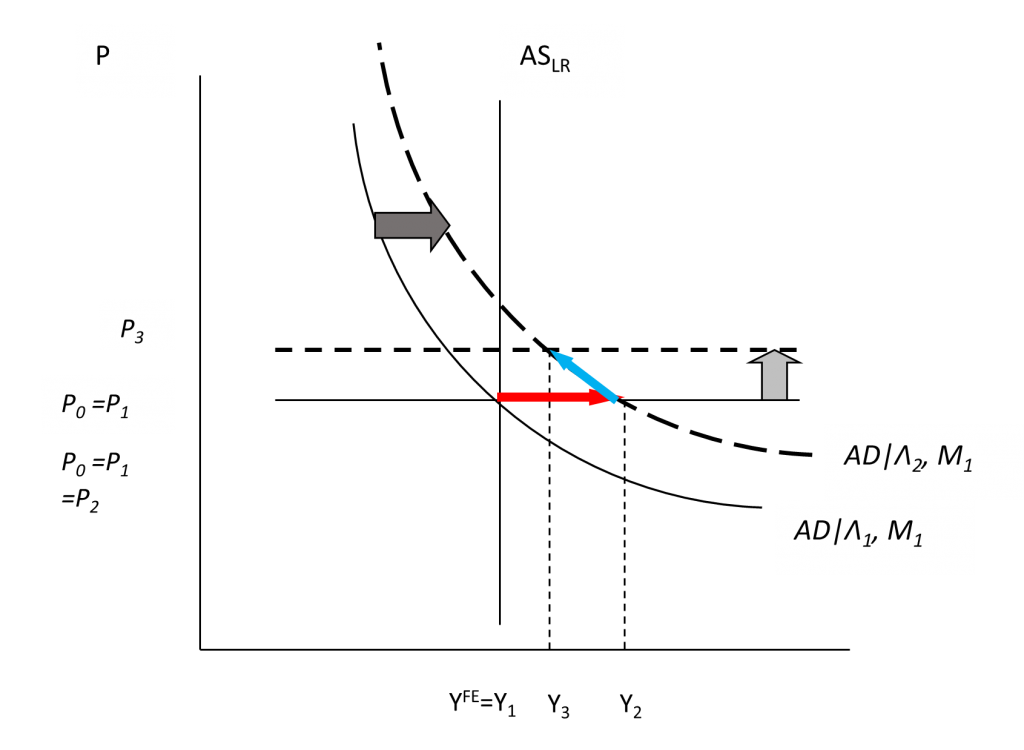
Figure 2: Outward AD shift.
How to interpret a one-time supply shock like temporarily high shipping costs, or disrupted supply chains? That’s an upward shift in the short run supply curve in period 2, resulting in what used to be called a “cost-push” inflation. Output falls, equilibrium moves as shown by the red arrow. In the absence of government intervention, the price level reverts over time.
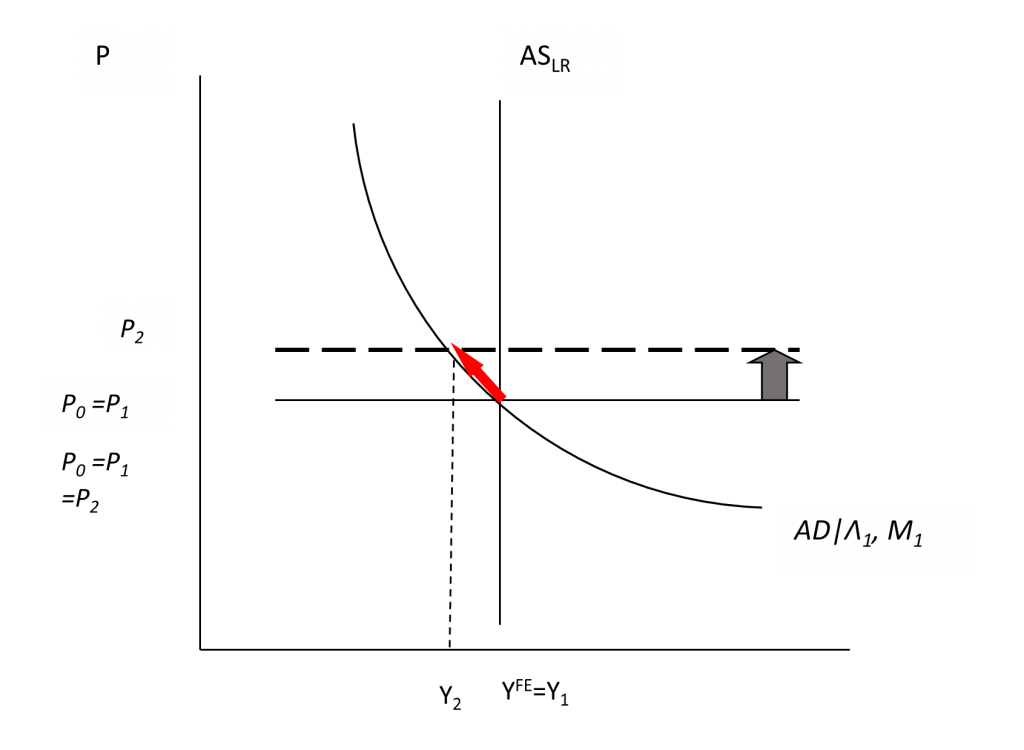
Figure 3: Cost push shock.
How about a longer term reduction in potential GDP, perhaps due to scarring effects of the pandemic (e.g., firms going bankrupt, etc.)? This is what is now often called a “supply shock” (for instance in the Blanchard-Quah identification scheme for structural VARs, supply shocks have permanent effects on output). The long run AS curve shifts in period 2 (dark gray arrow). In period 3, the price level rises in response to the (now) positive output gap in period 2. This then yields the stagflation case, even without dynamics induced by adaptive expectations, as the price level rises and output falls (as shown by the red arrow).
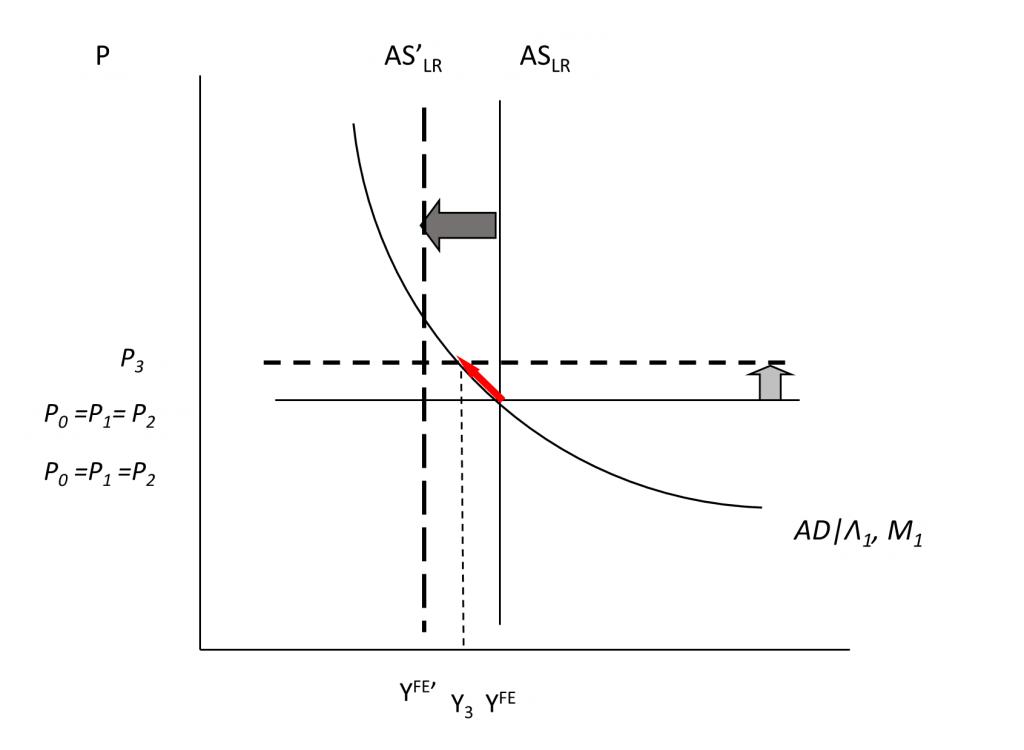
Figure 4: (Permanent) Supply shock.
Interpretation of Recent Events
Which interpretation best fits the data? Well, let’s consider the data:
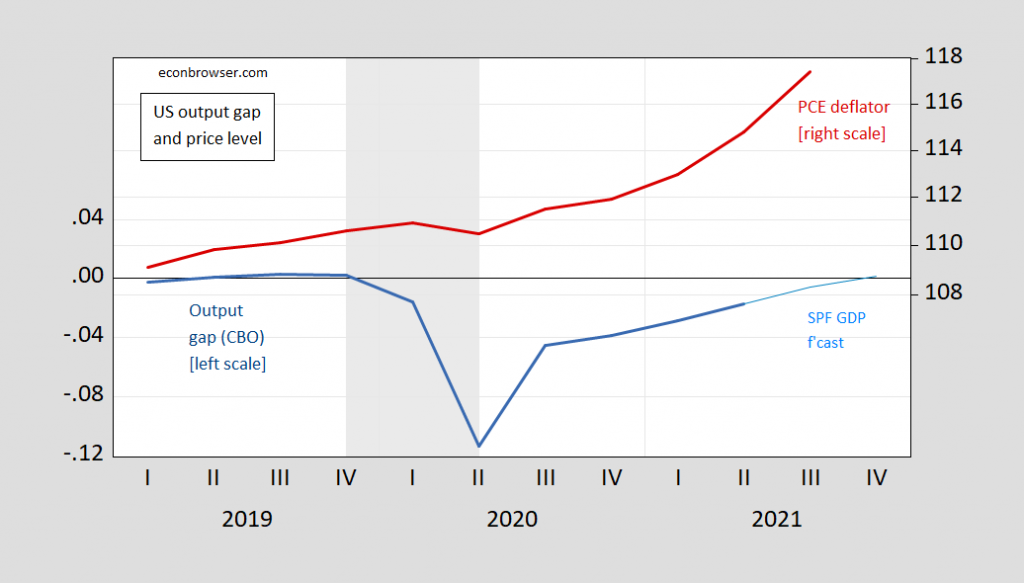
Figure 5: Output gap (blue, left scale), and projected gap using SPF August GDP forecast and CBO estimate of potential (light blue, left scale), and personal consumption expenditure deflator (red, right log scale); Q3 observation based on Cleveland Fed nowcast as of 10/15. NBER defined recession dates shaded gray. Source: BEA, CBO, Survey of Professional Forecasters, NBER and author’s calculations.
The story is complicated by the fact that even with the output gap at essentially zero in 2019, PCE inflation was trending up at about 1.4%. The small price drop in 2020 is then consistent with an inward shift in AD in Q1 and Q2 of 2020, and an inward shift of long run aggregate supply (due to constrained supply coming from public health measures).
Post-recession, acceleration of inflation (shown by the steepening of the log price series) in 2021Q2 and Q3 is then more consistent with a non-demand influence (given the negative output gap in those periods — assuming potential is being accurately measured). Unfortunately, one can’t distinguish clearly between cost-push and permanent supply shocks. The interpretation of supply chain disruptions that are temporary (albeit somewhat persistent) is consistent with cost-push inflation. The interpretation that supply chain disruptions will be permanent (i.e., shipping costs will remain elevated and overseas production problems will continue unabated) means that the inward long run AS shift is the better interpretation.
Note a one-time jump in oil prices implies a one-time upward move in the short run AS curve (unless the shift is so big that it makes a lot of capital stock obsolescent given new relative prices).
Deutsche Bank thinks supply chain problems likely to get worse:
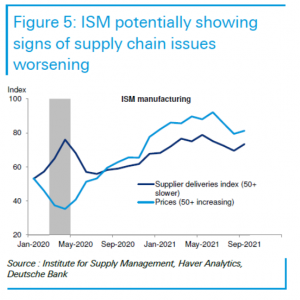
Source: Weidner, et al. “ID’ing the supply and demand forces rocking the economy,” US Economic Perspectives, October 6, 2021.
On the other hand, shipping costs are coming down.
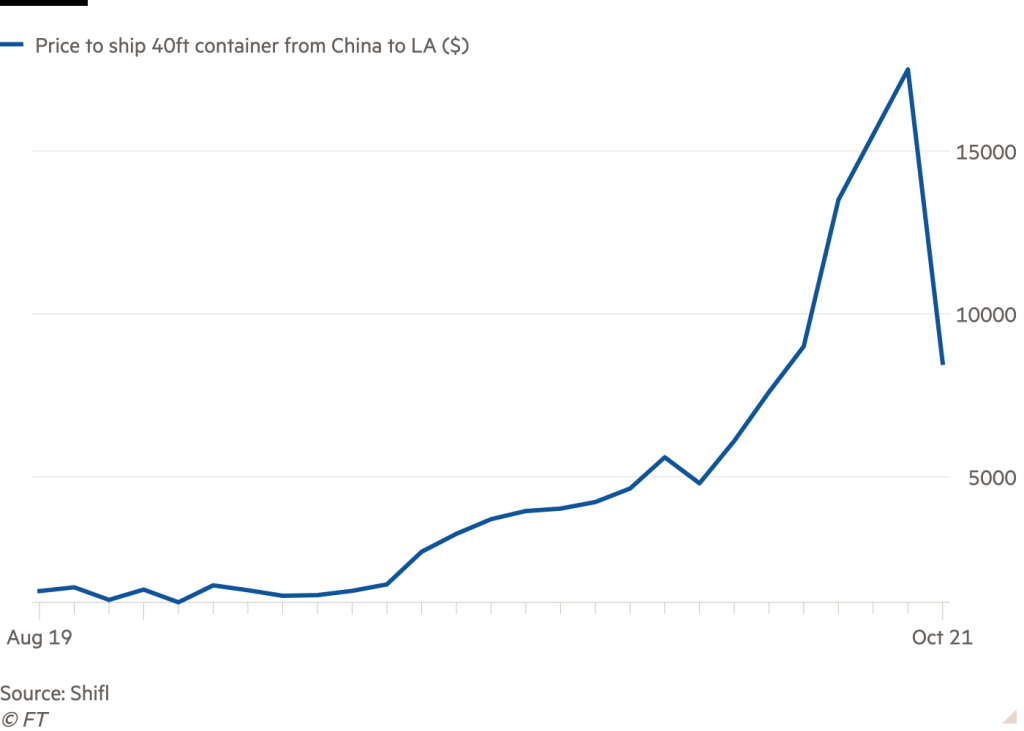
Source: FT, October 7.
But semiconductor chips remain in short supply, hindering production, even if the labor stock and capital stock remain largely untouched. Also, oil prices have risen and stayed high (and natural gas has risen recently, but less so than in Europe).
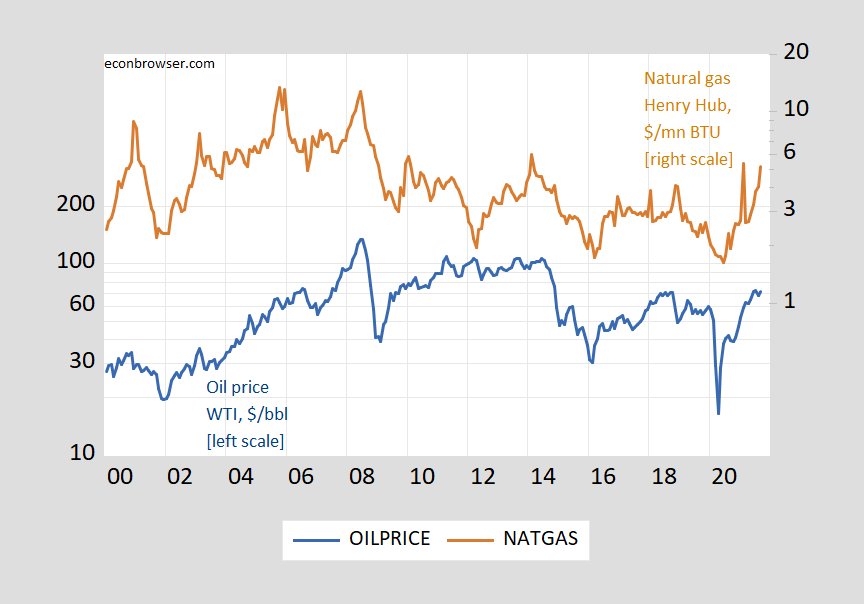
Figure 6: Price of oil, WTI, $/barrel (blue, left log scale), and price of natural gas, Henry Hub, $/mn BTU (brown, right log scale). Source: FRED.
So, no clear message on cost-push shocks.
Expectations Interpreted
How do expectations fit in? If actual lagged inflation feeds into expected one-for-one,
πet = φ πt-1, φ = 1
then the price level (in Figure 3) will continue to rise after the initial shock. Expansionary fiscal or monetary policy then could prevent a rise in unemployment, but at the cost of building in a continuing sequence of rising short run AS curves. If expectations are well-anchored, then the price level will revert to the original level (after incorporating the price level trend). If lagged inflation feeds into expected with less than unit coefficient (φ < 1), reversion still occurs, but takes longer. (A wage-price spiral could also be interpreted in this model as a cost-push shock; higher expected inflation feeds into wage demands, which through a cost-markup equation leads to higher prices.)
I discussed long term expectations developments here, but for examination of whether long term expectations remain anchored, see the IMF WEO‘s Chapter 2.
Addendum: Goldman Sachs tries to distinguish between a short run output gap (where supply bottlenecks constrain aggregate supply) and long run output gap (wherein potential GDP is determined by more conventional determinants like the labor stock). In the GS model, the short run output gap is very positive, while the current LR output gap is about -2%, not too different from the CBO estimated gap.
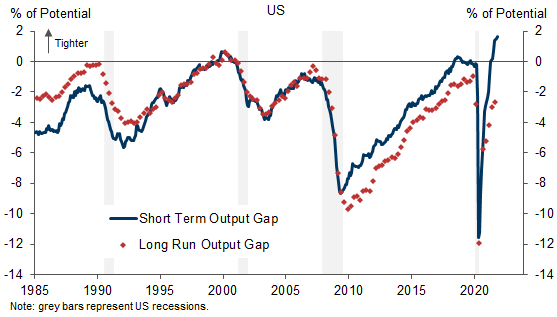
Source: Struyven, et al., “Tight Now, Slack Later,” Global Economic Analyst, Goldman Sachs, October 15, 2021.
Disclosure: None.


