A Detailed Look At Manufacturing
As I wrote on Monday, the big question for this year is whether the recessionary effects of the Fed rate hikes have just been delayed, or whether, because the rate hikes have stopped, so has the headwind they normally produce. Watching manufacturing and construction, especially housing construction, is what I expect to supply the answer.
On Monday I focused on housing construction and sales. Since there’s no big economic news today, let’s take a more detailed look at manufacturing.
There are three manufacturing metrics that are “official” components of the index of Leading Economic Indicators: the ISM manufacturing new orders subindex, average weekly hours of manufacturing workers, and capital goods new orders. Note that since manufacturing makes up less of the US economy than it did in the 20th century, it takes a steeper downturn in these components to be consistent with a recession than it used to.
Let’s start with the ISM manufacturing index and its new orders component, which were last updated at the beginning of this month:

These are in a definite uptrend, although neither has definitively broken above the dividing line of 50 which separates expansion from contraction.
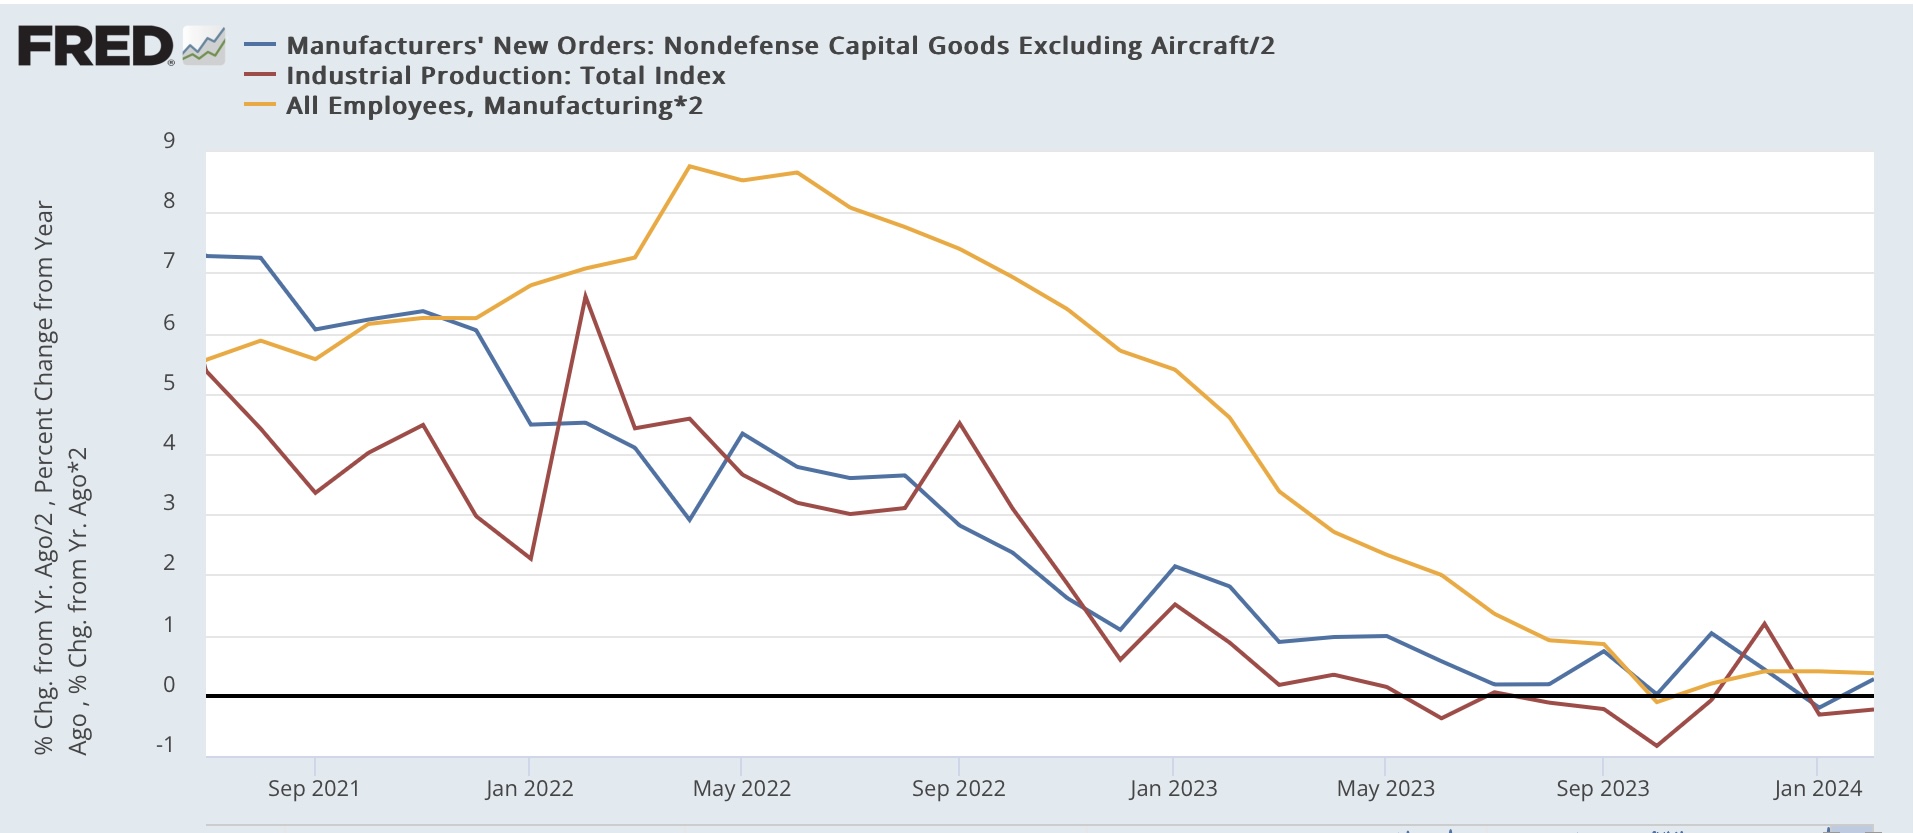
Next, let’s compare capital goods new orders, which were reported yesterday for February (dark blue), with industrial production (red), a premier coincident indicator, and also manufacturing employment from the payrolls survey (gold), all YoY for easier comparison. First, here’s the historical look:

Note that capital goods orders are very noisy (one reason I typically don’t highlight them), and did not turn negative in advance of the Great Recession. Nevertheless, they generally do turn in advance of industrial production, which typically turns in advance of manufacturing employment.
A similar dynamic has existed since the pandemic:

YoY gains in new capital goods orders decelerated first, followed by industrial production, followed last by manufacturing employment. The two first metrics are generally flat YoY, and manufacturing employment is only slightly positive.
Now let’s compare the average manufacturing workweek (black) with capital goods orders, both again YoY and first historically:

The average manufacturing workweek is even more leading than capital goods orders, turning first, but is even more noisy, and over-sensitive to the downside. That is, sharp declines in manufacturing hours always happen before recessions, but a downturn in hours frequently does not presage a recession at all.
Here’s the post-pandemic look at these two metrics:

Hours turned negative first, and if anything are getting “less bad” in recent months, while capital goods new orders, as already indicated, are essentially flat YoY.
Put the data together, and you get a relatively mild manufacturing recession in 2023, which appears to be recovering this year, as the ISM new orders index and the manufacturing workweek are trending higher (if not positive yet), while capital goods orders and production are flat. Manufacturing employment growth -the least leading metric - appears still to be decelerating.
Before I conclude, let’s take a brief updated look at transportation. Remember, the theory is that everything that is produced must be shipped to market. So to confirm a trend, both should be moving in the same direction.
Here is the Freight Transportation Index through January (dark blue), the noisier and more negatively biased Cass Transportation Index (light blue), compared with heavy weight truck sales which has been an excellent leading indicator (red):

In February, preliminarily there was a steep drop in excess of -3.5% in the Freight Transportation Index, but it has not been updated at FRED, possibly because at least one component (air freight) was withheld pending further seasonal adjustments.
There was a steep drop off in all of these metrics late last year following the Yellow Freight bankruptcy. The Cass Index and truck sales may be showing the beginning of a recovery from that, although the data is too noisy to say anything definitive.
One final note: we’ll bet a detailed updated look at the spending side of construction and production via the personal spending report this Friday.
More By This Author:
Repeat Home Sales Price Declined Slightly In JanuaryAs Mortgage Rates Remain Rangebound, So Do New Home Sales
Signs Of A Thaw In The Frozen Existing Homes Market, But A Very Long Way To Go
Disclaimer: This blog contains opinions and observations. It is not professional advice in any way, shape or form and should not be construed that way. In other words, buyer beware.


