

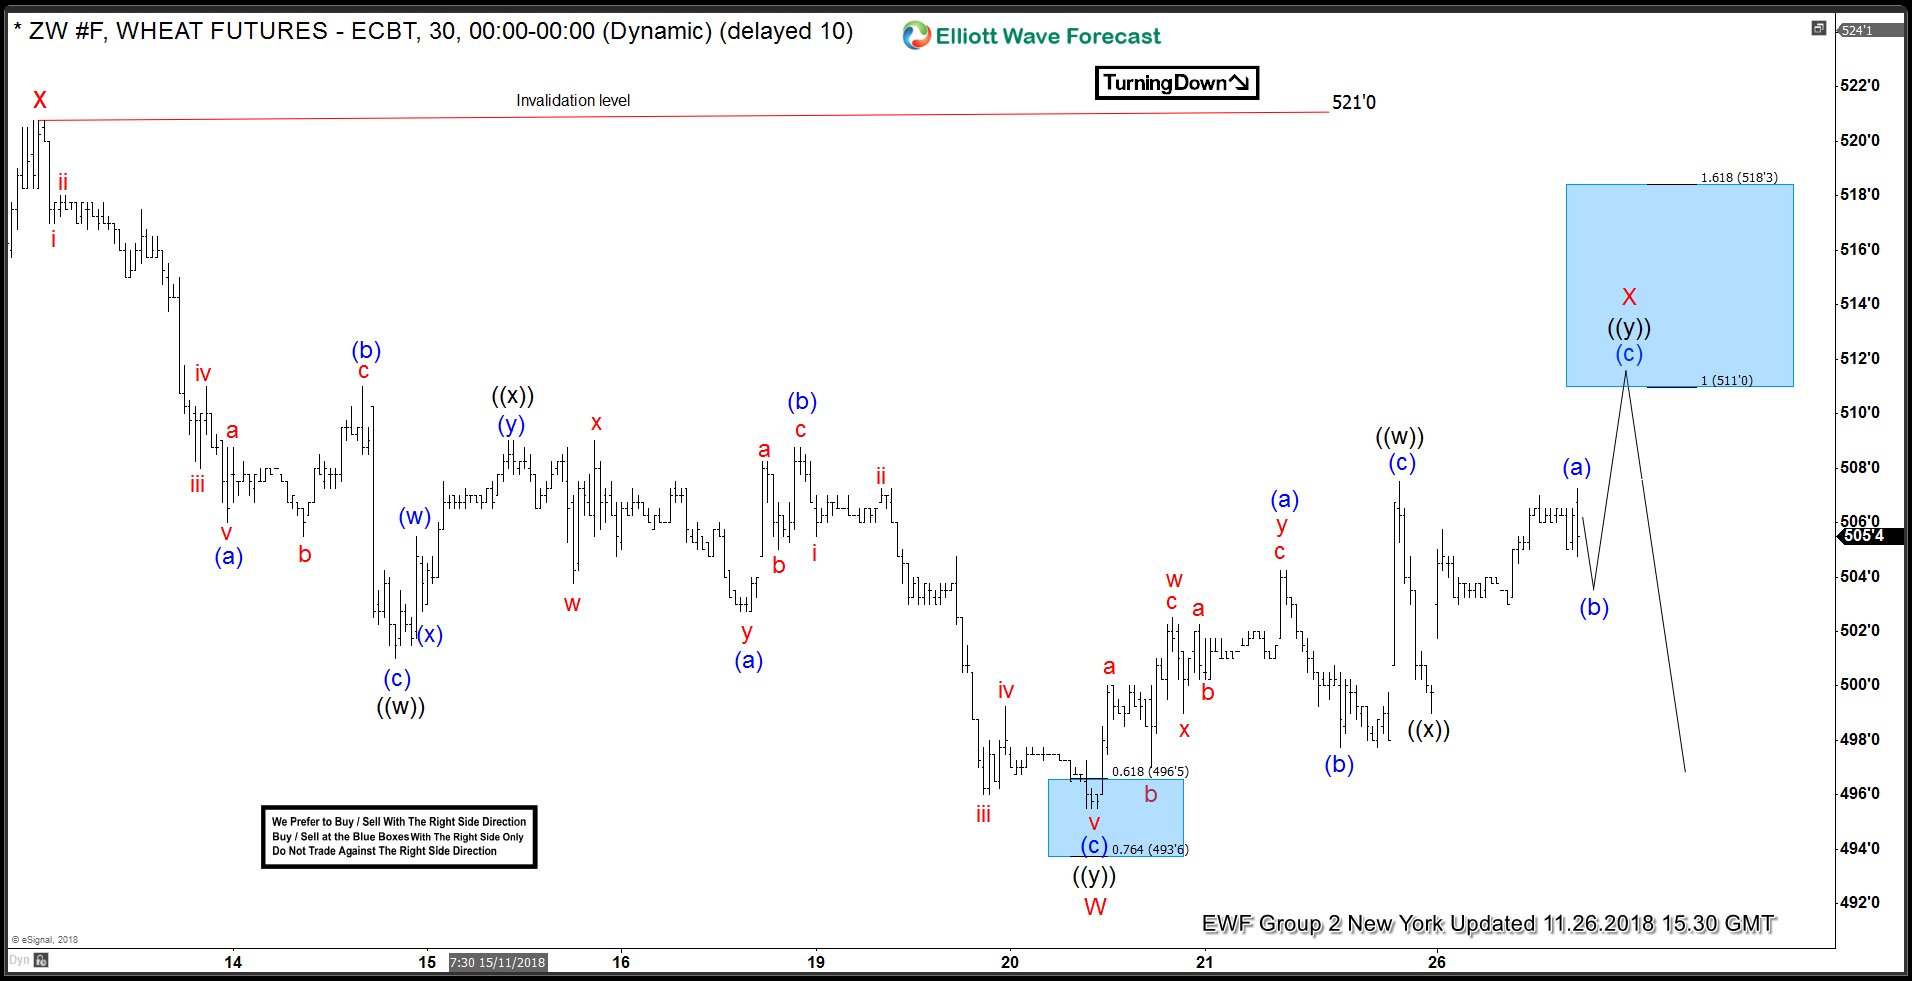
Hello fellow traders. In this technical blog we’re going to take a quick look at the Elliott Wave charts of Wheat Futures, published in members area of The Website. As we can see at the charts below, ZW #F is doing short term recovery against the 521'0 peak, labelled as wave X red . Proposed short term bounce seems to be unfolding as a Elliott Wave Double Three pattern. Currently the bounce is showing incomplete sequences from the lows, when we have 5 swings as of right now. Proposed X red recovery is missing another swing up toward blue box area 511'+ to complete proposed Double Three ( 7 swings structure) and then it should resume the decline or turn lower in 3 waves at least.
ZW #F 1 Hour Elliott Wave Analysis 11.26.2018
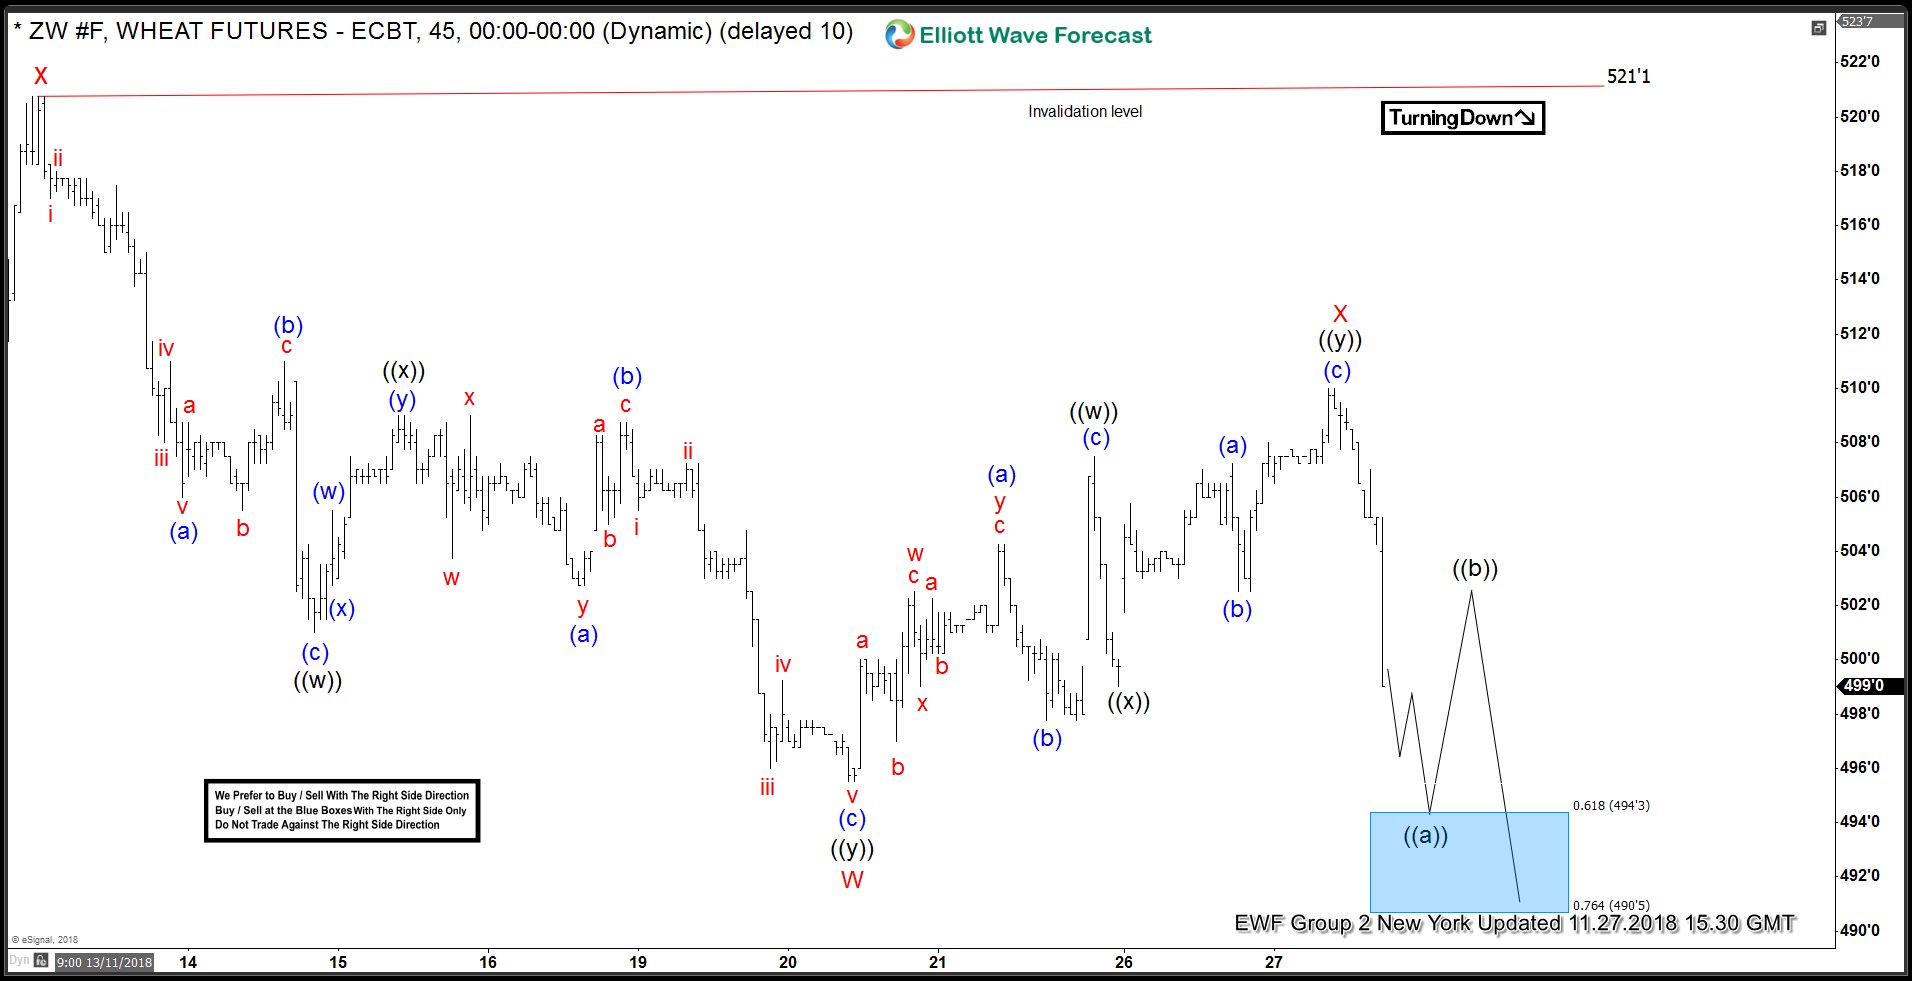
ZW #F 1 Hour Elliott Wave Analysis 11.27.2018
X red recovery gave us proposed 7th swing up , however it missed blue box area by a few points. Sellers appeared early and we got sharp decline as expected in 3 waves at least.



Comments
Log in or sign up to join the conversation.