


In this Elliott Wave update, we examine the long-term structure in Baker Hughes Company (BKR). The stock completed a major bullish Super Cycle in 2007 before entering a prolonged correction that eventually bottomed in 2020.
That decline unfolded in 3 major swings and completed an important long-term low near 8.99. Since then, BKR has started a new bullish cycle and has been building a double-nest structure. The current pullback reached the 48.04–36.92 Blue Box Area, where another important low can form.
If buyers respond from this zone as expected, BKR should begin forming higher highs and higher lows before a larger Wave 3 breakout develops over the next several months to quarters.
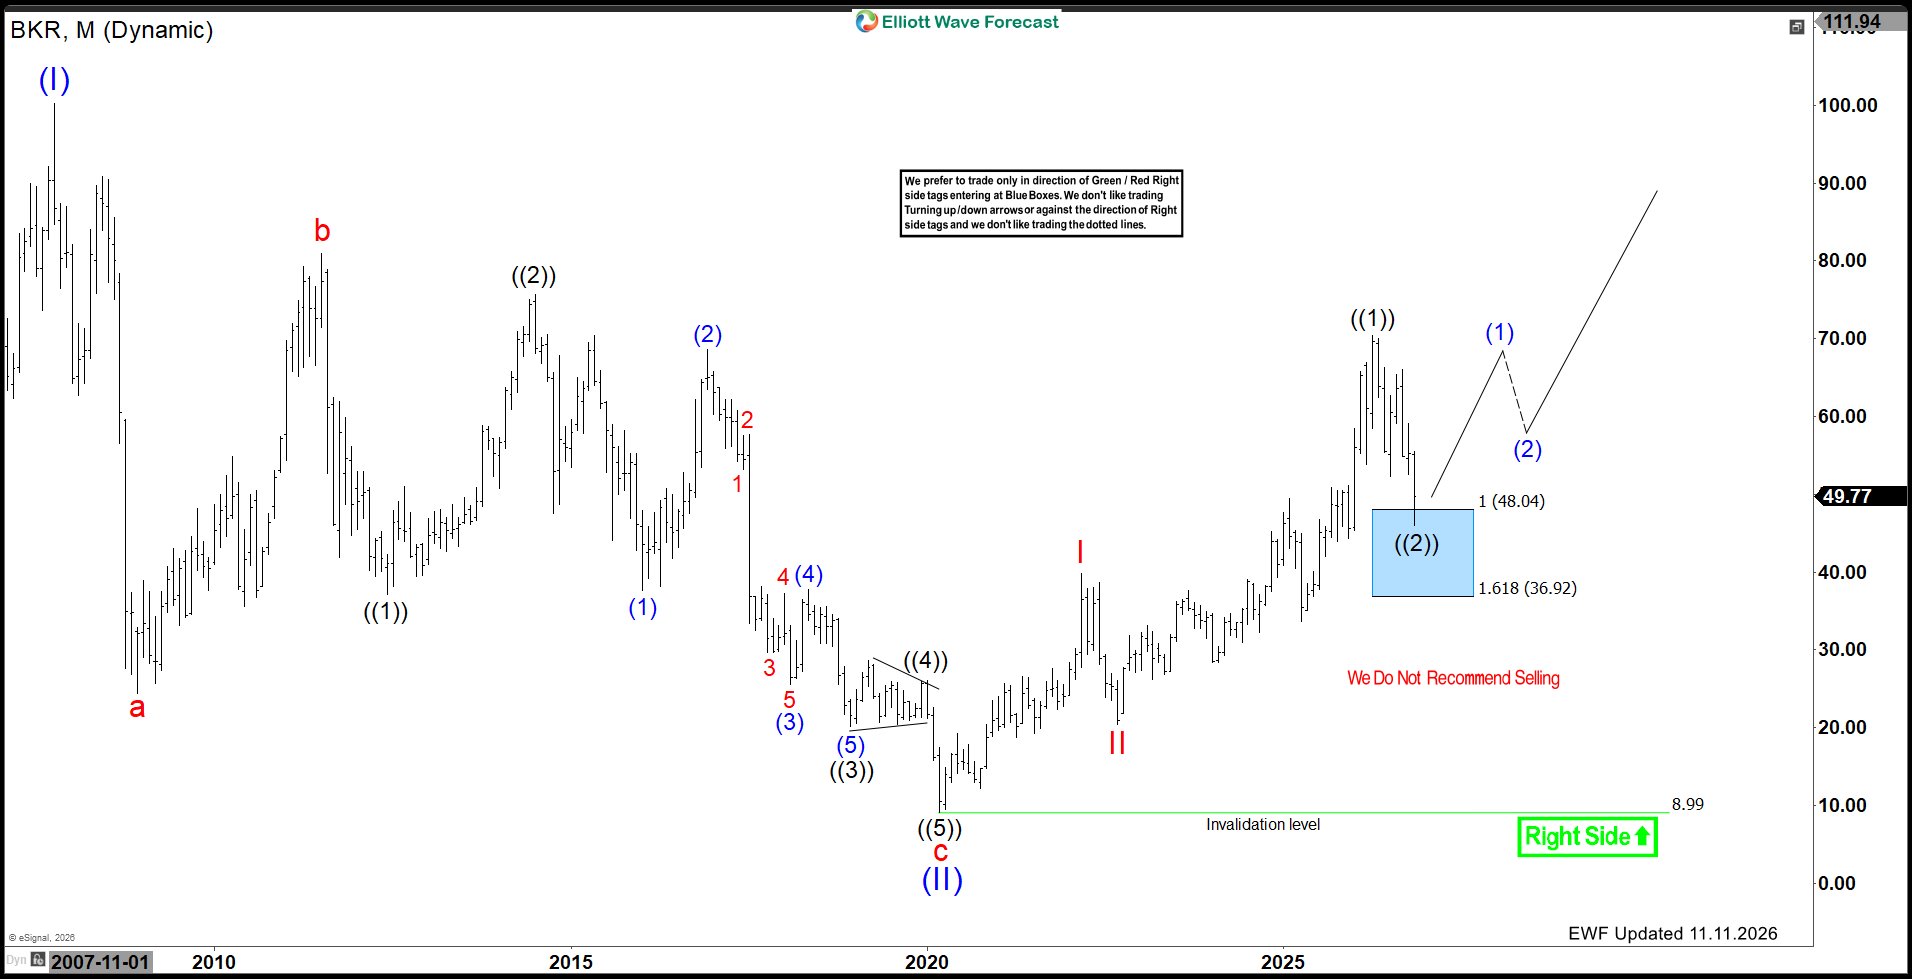
BKR Bullish Super Cycle Ended in 2007
Looking at the monthly chart, BKR completed a major bullish cycle at the 2007 peak. From there, the stock entered a prolonged corrective phase that lasted more than a decade.
Rather than developing as a new impulsive bearish cycle, the decline unfolded in a large 3-swing corrective structure.
The first major decline formed wave a, followed by a substantial recovery in wave b. Afterward, another prolonged decline in wave c carried the stock toward its 2020 low.
This completed the larger wave (II) correction and established the foundation for the next long-term bullish cycle.
2020 Low Completed the Long-Term Correction
The correction eventually reached its conclusion near 8.99 in 2020.
That low represents an important structural turning point. After years of corrective price action, BKR finally started developing impulsively to the upside.
The advance from the 2020 low has since produced a series of higher highs and higher lows, which supports the view that a new long-term bullish cycle has already started.
More importantly, the Elliott Wave structure from that low is beginning to form a bullish nesting pattern.
Blue Box Area at 48.04–36.92 Could Complete Wave ((2))
Most importantly, the current correction is approaching the Blue Box Area between 48.04 and 36.92.
This zone represents the next high-frequency support area where wave ((2)) can find a low and buyers are expected to enter.
As price reaches the Blue Box, the focus should increasingly shift away from chasing the downside and toward looking for signs that buyers are beginning to regain control.
A bullish reaction from this region would strengthen the view that wave ((2)) has completed and that the next impulsive phase is ready to begin.
Double Nest Can Develop From the Blue Box
If BKR establishes a low inside the Blue Box, the next rally should begin another five-wave advance in wave (1).
After that initial impulse, a smaller corrective pullback in wave (2) can develop.
This would create the second wave 1–2 structure and complete a bullish double nest:
Wave ((1)) higher from the 2022 low
Wave ((2)) into the 48.04–36.92 Blue Box
Wave (1) higher
Corrective wave (2) pullback
Once those structures are in place, several degrees of third waves can begin unfolding together.
That is where the potential for significant upside acceleration emerges.
Higher Highs and Higher Lows Should Follow
The first confirmation should come through a sequence of higher highs and higher lows after the Blue Box reaction.
Initially, buyers need to establish an impulsive rally away from support. A corrective pullback should then remain above the Blue Box low before another breakout occurs.
If that sequence develops, it would provide stronger evidence that the larger Wave 3 advance is underway.
Therefore, the coming months should become increasingly important for determining whether the bullish nesting structure is ready to accelerate.
Wave 3 Breakout Could Be the Next Major Move
The larger Elliott Wave setup suggests that BKR is approaching one of the more important stages of its bullish cycle.
Nested wave 1–2 structures often precede strong third-wave extensions. Once the smaller corrections finish, several Wave 3 degrees can begin moving higher simultaneously.
Consequently, BKR could transition from the relatively gradual recovery seen since 2020 into a much stronger trending phase.
The expected sequence calls for the stock to establish its wave ((2)) low, rally in wave (1), complete another corrective wave (2), and then break out aggressively in Wave 3.
This development can unfold over the next several months to quarters.
Bigger Picture Remains Bullish
The long-term structure remains constructive as long as the 2020 low stays intact.
BKR spent more than a decade correcting the cycle from the 2007 peak before finally reaching its long-term low in 2020. Since then, the character of the market has changed from corrective to impulsive.
The current decline should therefore be treated within the context of that new bullish cycle.
The broader bullish outlook remains valid above the 8.99 invalidation level, while the 48.04–36.92 Blue Box Area represents the next important zone where buyers can establish another higher-degree low.
Technical Summary
To summarize, BKR completed a major bullish Super Cycle in 2007 and subsequently corrected that advance in 3 major swings into the 2020 low near 8.99.
Since 2020, a new bullish cycle has started. The first five-wave impulse completed wave I , while the current wave ((2)) correction is at the 48.04–36.92 Blue Box Area.
A low inside this region can establish the first part of a larger double-nest structure. From there, we expect BKR to begin producing higher highs and higher lows, followed by another smaller wave (2) correction.
Once that nesting process completes, the structure should set the stage for a potentially powerful Wave 3 breakout over the next several months to quarters.
As long as the broader bullish structure remains intact, the current pullback should ultimately represent an opportunity ahead of the next major expansion higher.



Comments
Log in or sign up to join the conversation.