

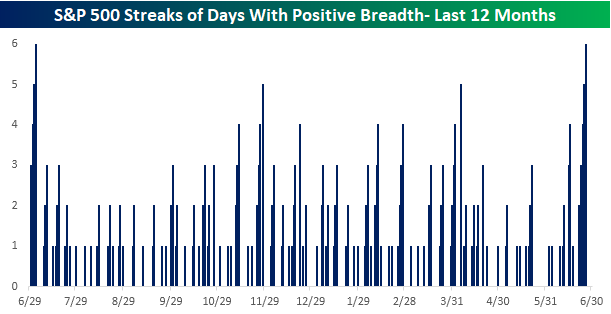
With five straight down days last week, you wouldn’t expect to see breadth, which has been weak for several weeks, to suddenly show strength, but that’s exactly what we saw last week. Through Friday’s close, the S&P 500 has more daily gainers than losers (positive breadth) for six straight days, which was tied for the longest streak of positive readings in nearly a year.
Just as unusual as last week’s positive breadth amid a falling market, today, the S&P 500 is up over 1%, and breadth is negative. After five straight days of positive breadth divergences last week, today we’re seeing a negative breadth divergence, extending the streak of divergent breadth days to a record six trading days. Like an unhealthy relationship, price and breadth just can't seem to agree on anything.
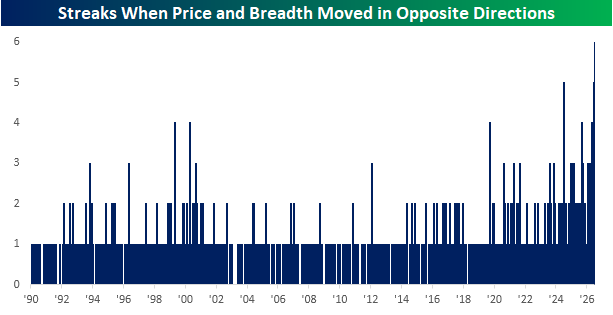
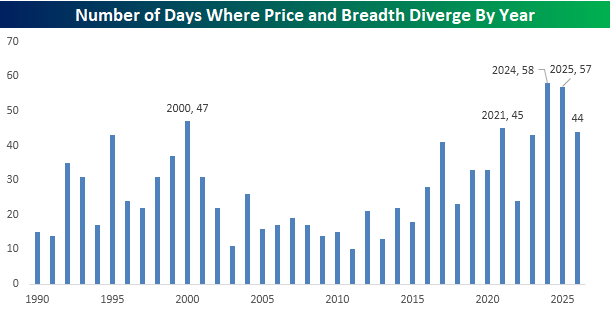
Besides the fact that we’re currently in the middle of the longest streak of divergent breadth days on record, the chart below also shows an increasing frequency of divergent breadth days in recent years. The chart below breaks down the number of diverging days by year. The record for most diverging days was 58 in 2024, followed by 57 in 2025 (we told you there was an increased frequency in recent years), but this year there have already been 44 – and the year is only half over!
There’s obviously no guarantee that the pace of diverging days in the second half will match the pace in the first half; if it did, the S&P 500 would have 88 diverging breadth days in 2026. That’s 30 more than the prior record from 2024 and works out to more than once every three trading days!


Comments
Log in or sign up to join the conversation.