

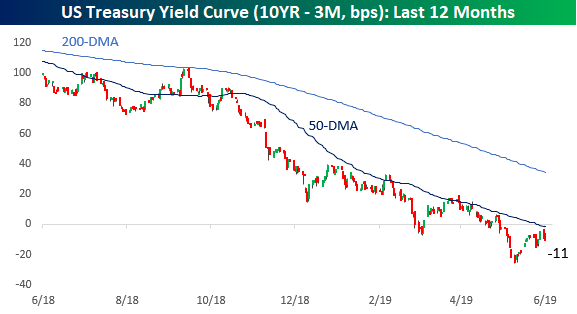
After moving down as low as -25 basis points (bps) earlier this month, the yield curve (the spread between the yield on the 10-year and 3-month US Treasuries) looked like it was going to move back into positive territory closing out last week. That was until the 50-day moving average came into play. On Friday, the yield curve finished the week inverted by less than 5 bps, but today it’s back inverted to the tune of 11 bps. Looking at the chart below, the latest experience with the 50-DMA looks to be just one in a series of times in the last year where the yield curve has stalled out at or near the 50-DMA. What will it be that breaks this trend? A larger than expected rate cut from the FOMC or a sharp increase in rates at the long end of the curve?



Comments
Log in or sign up to join the conversation.