


In this technical article, we present Health Care Select Sector SPDR Fund ETF (XLV) Elliott Wave charts. Recently, the ETF completed an intraday Zig Zag correction at the Equal Legs area, providing a high-probability trading opportunity.
Following the completion of the corrective structure, buyers stepped in as expected, leading to a continuation higher and a break to new highs. In the sections below, we will outline the Elliott Wave forecast and highlight the trading setup that led to this move.
Before we take a look at the real market example, let’s explain Elliott Wave Zigzag.
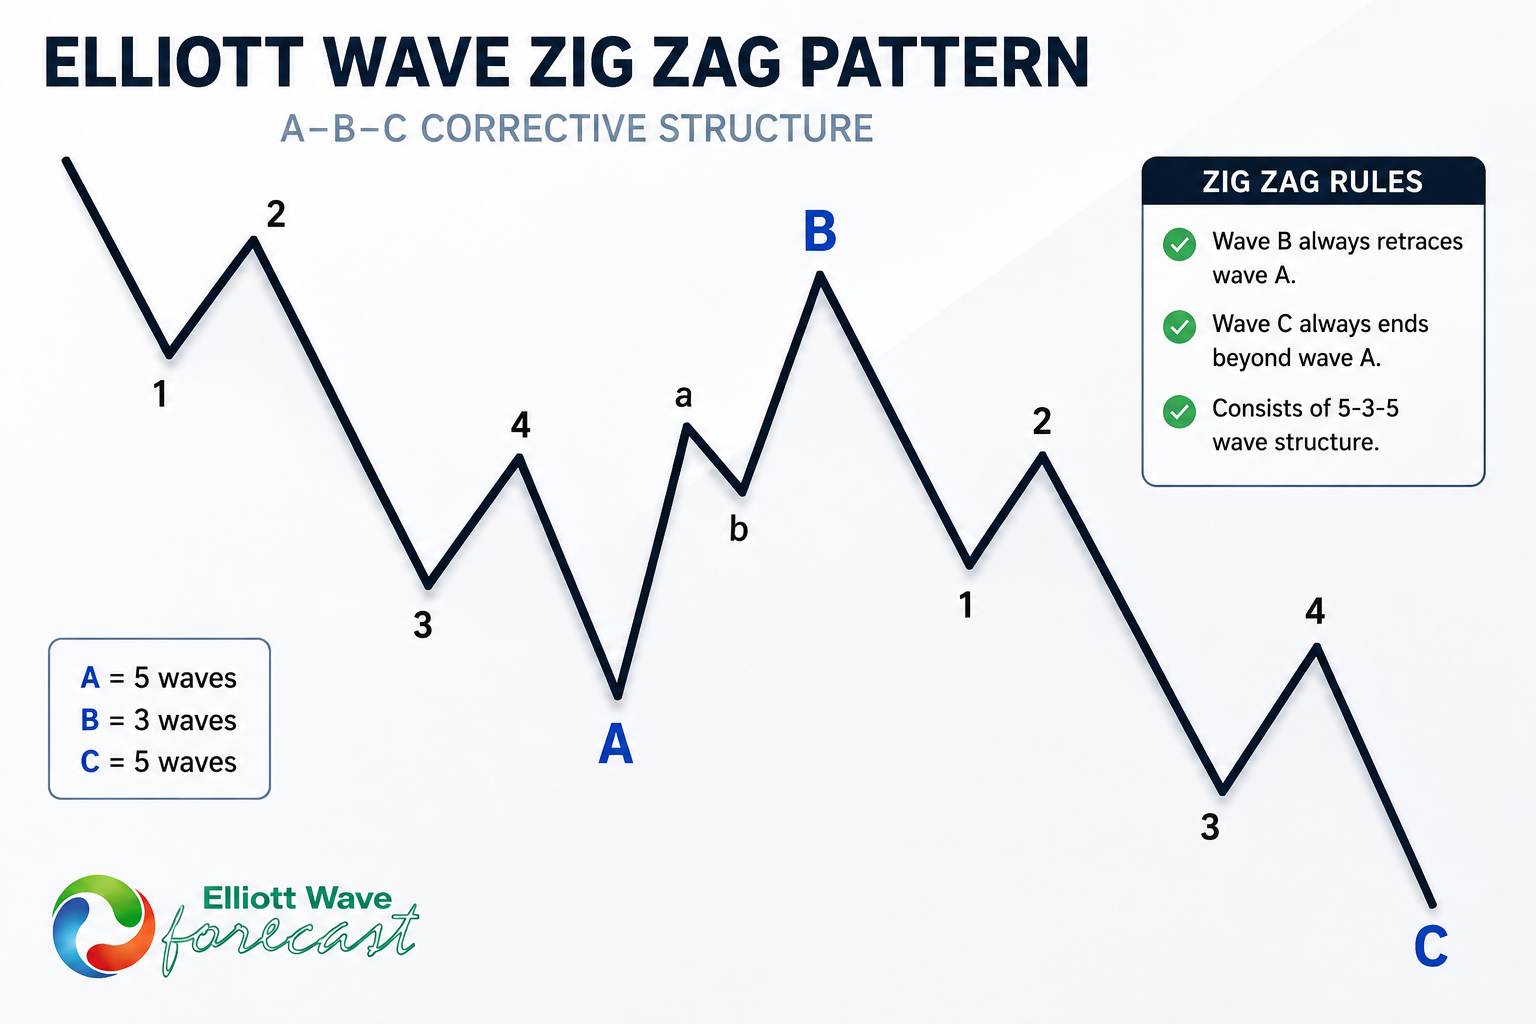
Elliott Wave Zigzag is the most popular corrective pattern in Elliott Wave theory . It’s made of 3 swings which have 5-3-5 inner structure. Inner swings are A,B,C where A =5 waves, B=3 waves and C=5 waves. That means A and C can be either impulsive waves or diagonals. (Leading Diagonal in case of wave A or Ending in case of wave C) . Waves A and C must meet all conditions of being 5 wave structure, such as: having RSI divergency between wave subdivisions, ideal Fibonacci extensions and ideal retracements.
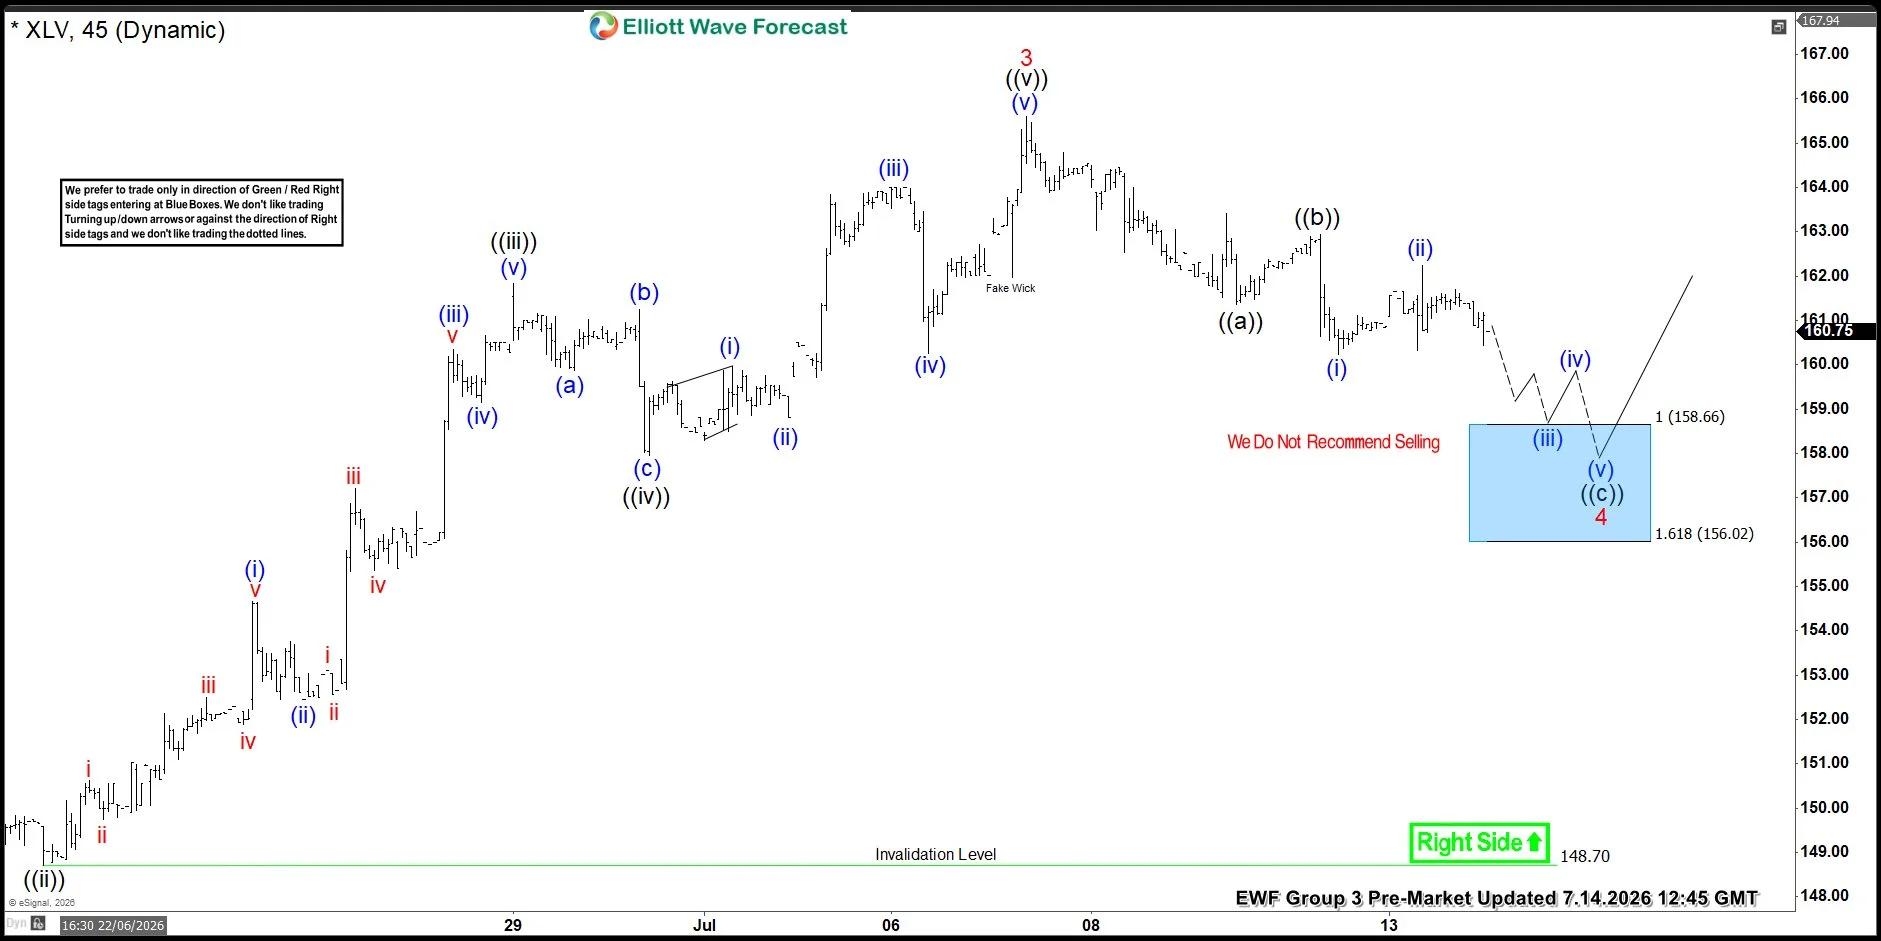
XLV 1-Hour Elliott Wave Analysis 07.14.2026
Health Care Select Sector SPDR Fund ETF is currently correcting against the 148.7 low. The ETF is undergoing a pullback that is unfolding as an Elliott Wave Zig Zag pattern.
We can clearly identify a five-wave structure in both legs of wave ((a)), followed by a three-wave bounce in wave ((b)). The ETF is now developing wave ((c)), which is expected to subdivide into five waves as well. At the moment, the price structure remains incomplete.
We anticipate the ETF to complete five waves lower in wave ((c)), targeting the 158.66–156.02 area. This zone represents a high-probability buying opportunity, where we plan to enter long positions in alignment with the dominant bullish trend. Given the overall bullish structure, we expect at least a three-wave reaction higher from the blue box area. Once the price reached the 50% Fibonacci retracement of the rally from the connector labeled ((b)), the trade became risk-free by moving the stop loss to breakeven while securing partial profits.
The setup would be invalidated only if the price breaks below the 1.618 Fibonacci extension at 156.02.
Official trading strategy on How to trade 3, 7, or 11 swing and equal leg is explained in details in Educational Video, available for members viewing inside the membership area.
90% of traders fail because they don’t understand market patterns. Are you in the top 10%? Test yourself with this advanced Elliott Wave Test
Quick reminder on how to trade our charts :
Red bearish stamp+ blue box = Selling Setup
Green bullish stamp+ blue box = Buying Setup
Charts with Black stamps are not tradable.
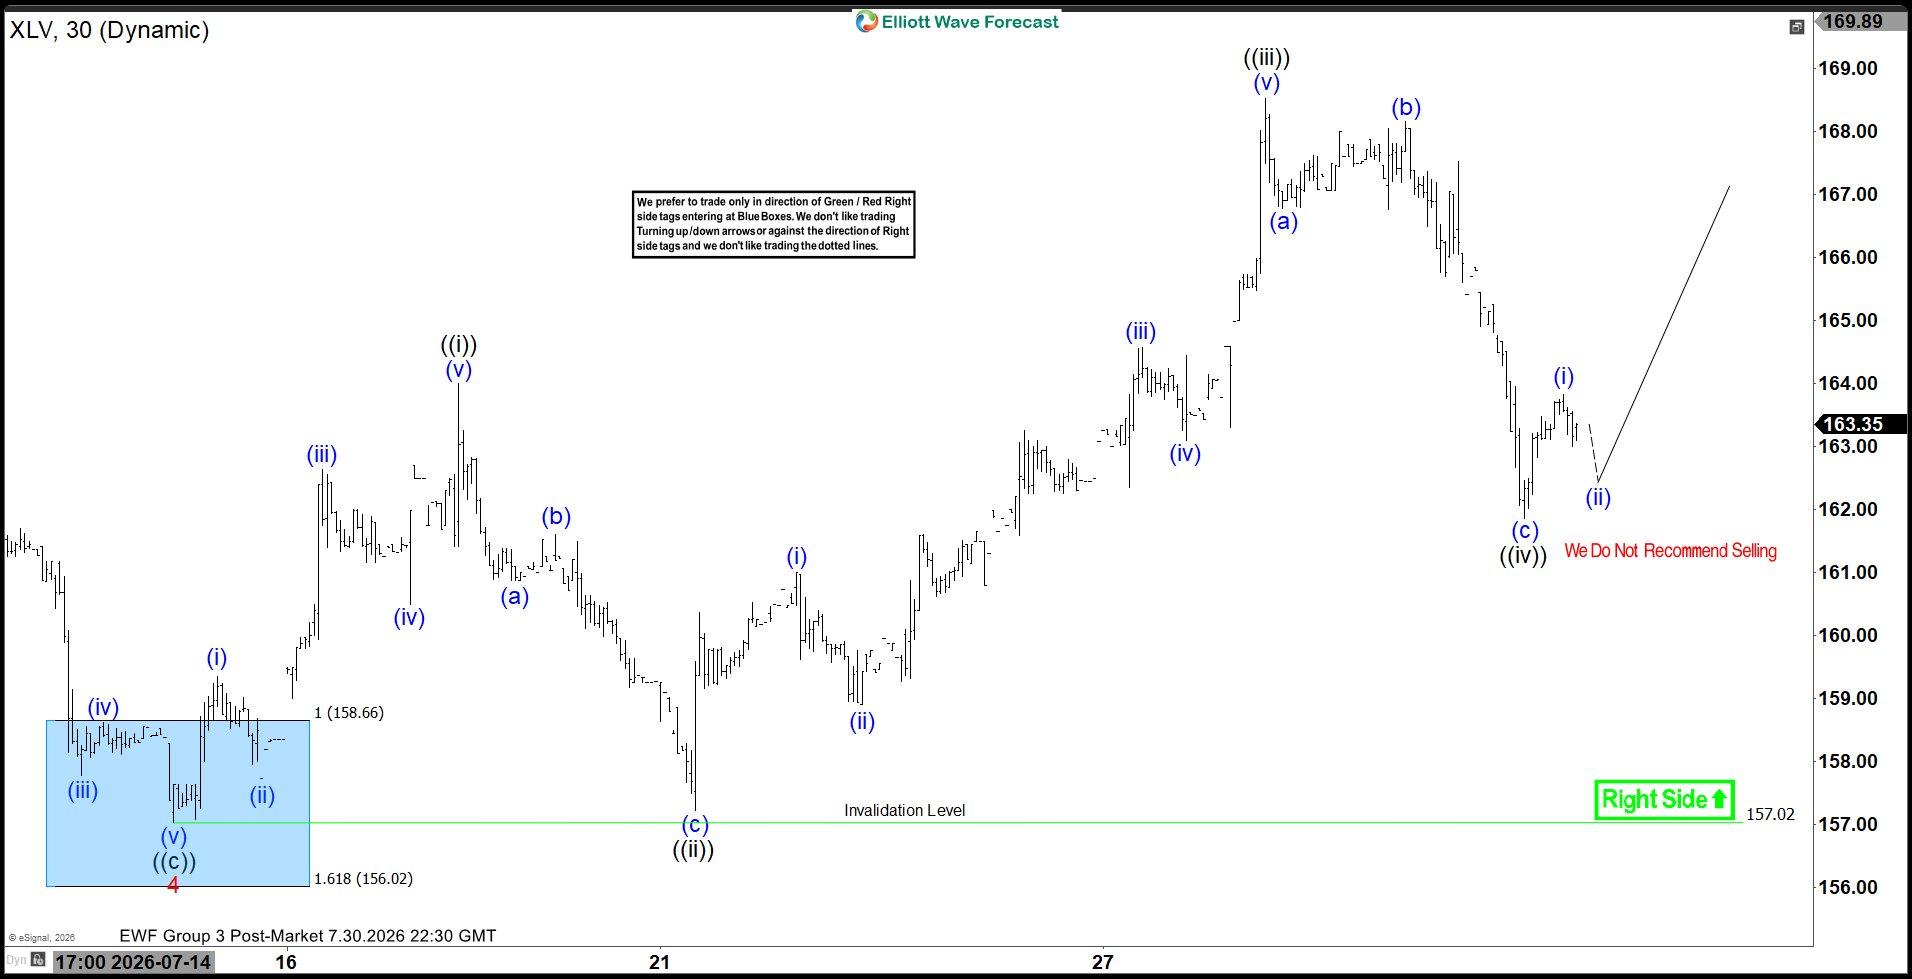
XLV 1-Hour Elliott Wave Analysis 07.30.2026
Health Care Select Sector SPDR Fund ETF completed its correction precisely at the proposed blue box buying zone and produced a strong bullish reaction. The price has since broken to new highs, confirming the continuation of the upside trend and validating the Elliott Wave outlook.



Comments
Log in or sign up to join the conversation.