

In this technical blog, we are going to take a look at the past performance of 1 hour Elliott Wave Charts of XLV, which we presented to members at elliottwave-forecast.com. In which, the rally from December 2018 lows & October 2019 lows, showed the higher highs in an impulse sequence favored more strength to take place. Also, the right side tag pointed higher & favored more strength against $93.71 low seen on 11/05/2019. Therefore, we advised our members to buy the dips in ETF in 3, 7 or 11 swings at the blue box areas. We will explain the structure & forecast below:
XLV 1 Hour Elliott Wave Chart
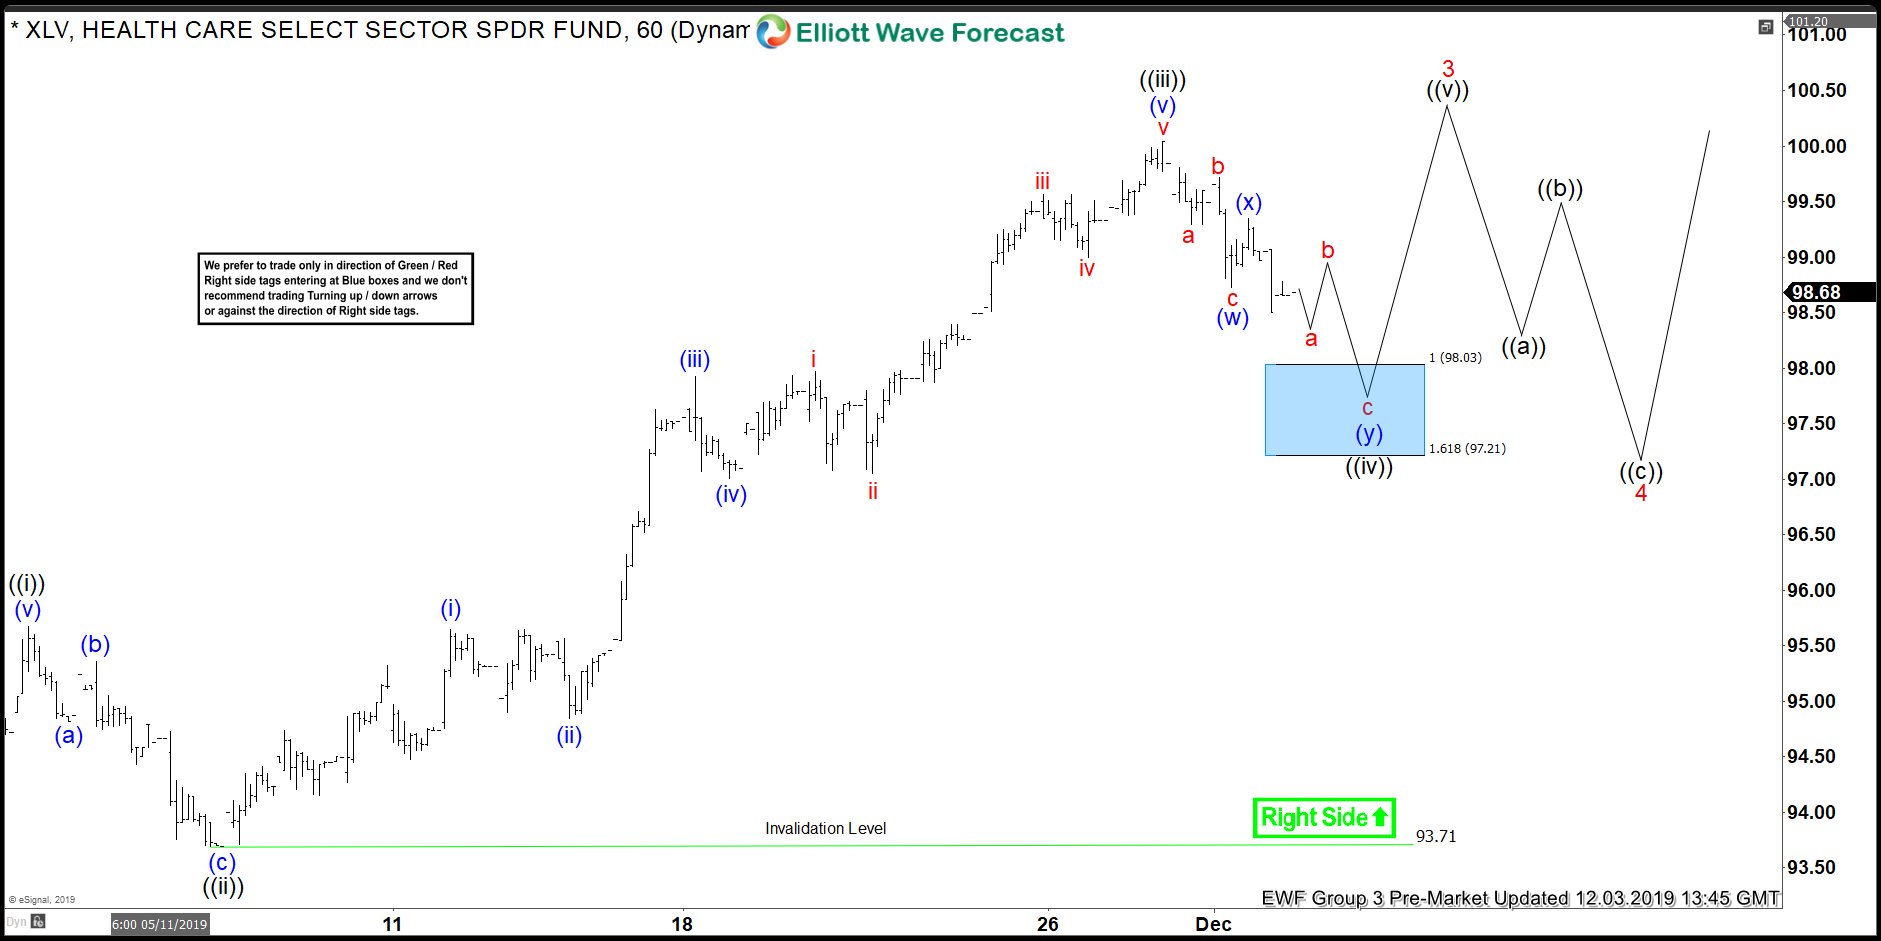
XLV 1 Hour Elliott Wave Chart From 12/03/2019 Pre-Market update, in which the 3 waves pullback to $93.71 low ended wave ((ii)). Up from there, the rally takes place in 5 waves impulse structure where wave (i) ended at $95.65 high. Wave (ii) pullback ended at $94.85 low, wave (iii) ended at $97.93 high, wave (iv) ended at $97.01 low and wave (v) ended at $100.04 high thus completed wave ((iii)). Down from there, wave ((iv)) pullback was expected to take place as a lesser degree double three structure where wave (w) ended at $98.73 low. Wave (x) bounce ended at $99.35 high and wave (y) was expected to reach $98.03-$97.21 short-term 100%-161.8% Fibonacci extension area of (w)-(x). Afterwards, the ETF was expected to resume the upside or do a 3 wave reaction higher at least.
XLV 1 Hour Elliott Wave Chart
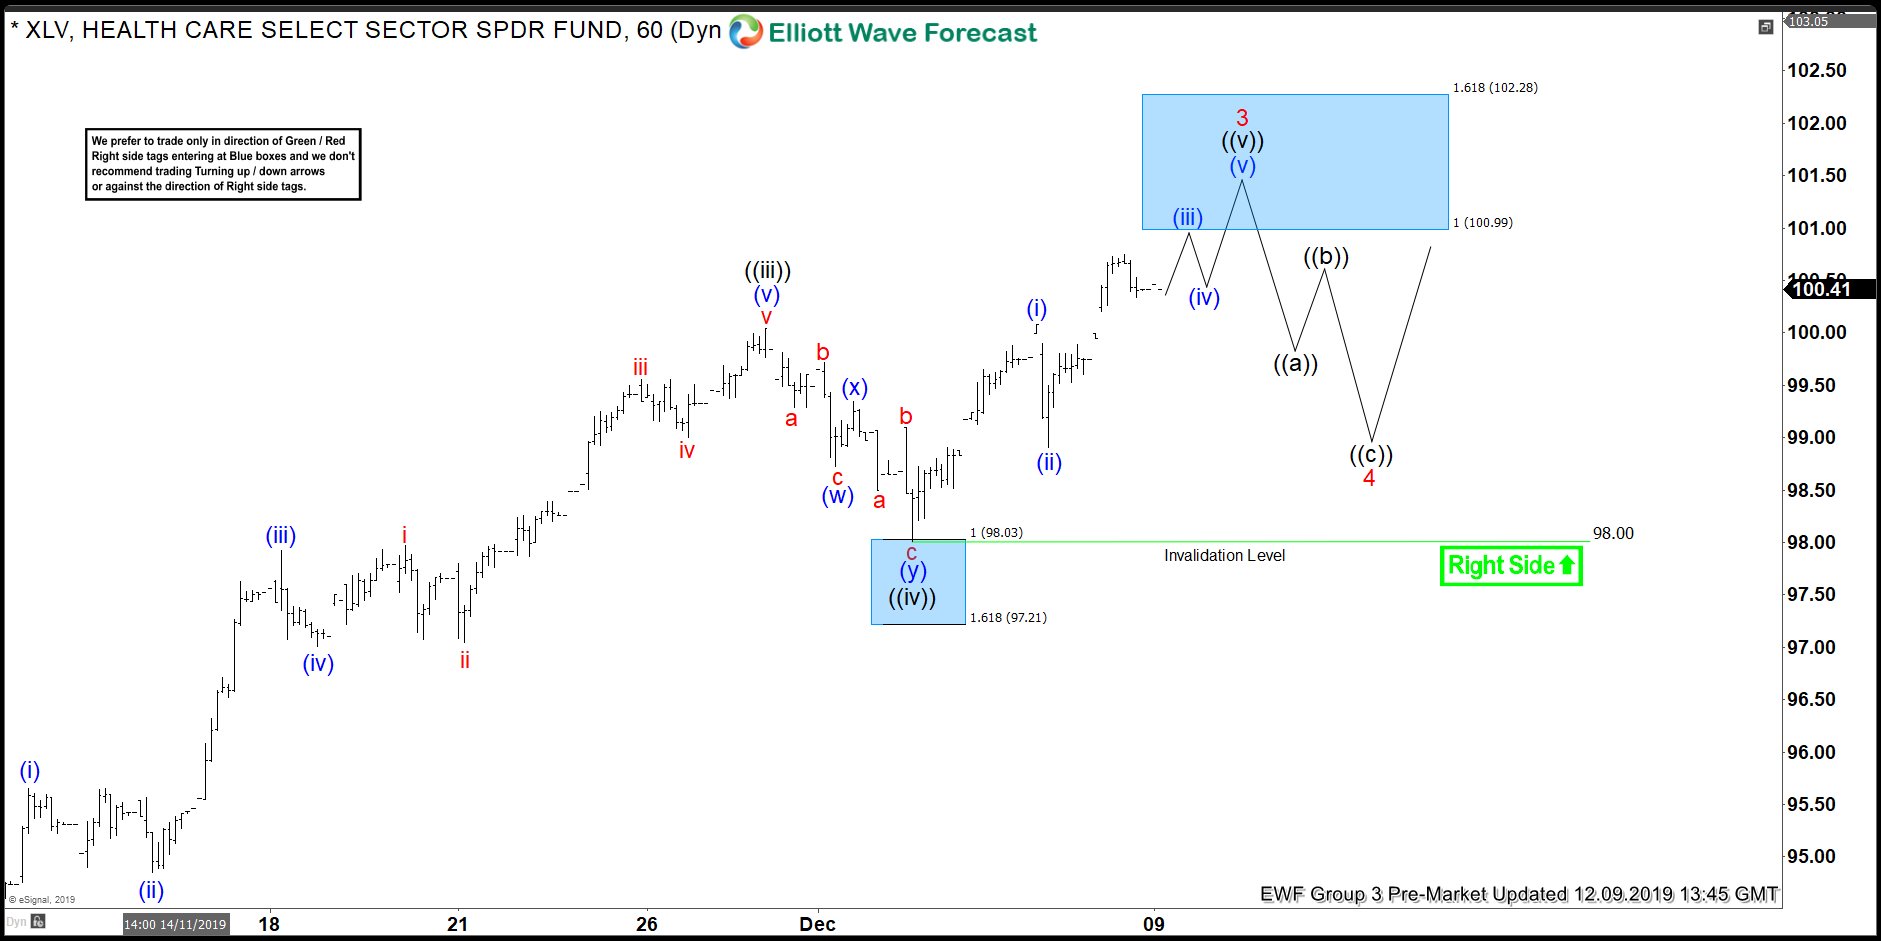
Here's 1 Hour Elliott Wave Chart of XLV from the 12/09/2019 Pre-Market update, in which the ETF managed to reach $98.03-$97.21 blue box area & reacted higher as expected. Allowed members to create a risk-free position shortly after taking the trade. Since then the ETF bounced strongly & managed to reach minimum extension area in wave ((v)) at $100.50-$101.28 i.e inverse 123.6%-161.8% of wave ((iv)). But, as far as dips remain above $98 low the ETF can extend higher towards $100.99-$102.28 areas as well before a pullback could take place. We don't recommend selling the ETF or chasing the strength at this stage.



Comments
Log in or sign up to join the conversation.