

On Friday, the WTI crude oil price pulled back from the session highs of about $106.41 to trade at about $102.14. The oil price trades within a descending channel formation in the 60-minute chart.
However, the light crude oil price made a late rebound to climb back towards the 100-hour moving average line. As a result, it recovered from the oversold levels of the 14-hour RSI.
WTI Crude Oil Fundamentals Overview
From a fundamental perspective, the light crude oil price trades during a relatively busy period in the US market. On Friday, the ISM Manufacturing PMI for April came in lower than expected, with 52.7 versus a forecast of 53, unchanged from the previous period. The ISM Manufacturing Employment Index for the month also fell short of 49, with a reading of 46.4, down from 48.7 in March, while the ISM Manufacturing Prices Paid beat the forecasted reading of 80, with 84.6, up from 78.3.
Earlier in the week, the Federal Reserve voted to keep the base interest rate unchanged at 3.75% as expected. The initial jobless claims for last week came in lower than expected, with 189k versus a forecast of 215k, down from the previous week’s equivalent of 215k.
In the latest US crude inventories, the API weekly crude oil stock for last week increased to -1.79 million, up from the previous week’s equivalent of -4.4 million. On the other hand, the EIA crude oil stocks change for last week fell to -6.233 million, down from the preceding week’s equivalent of 1.925 million.
WTI Crude Oil Technical Analysis (the 60-min Chart)
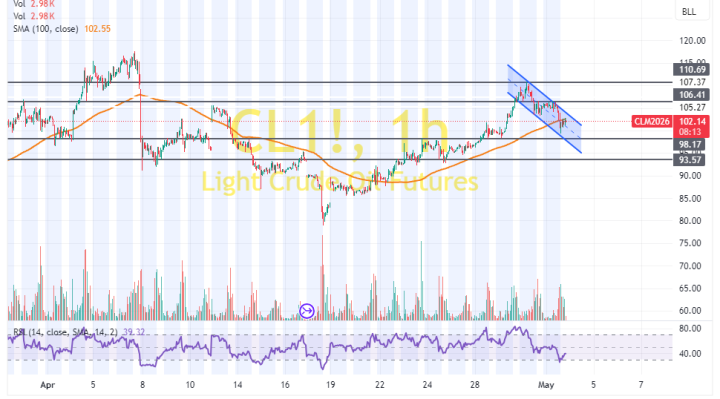
Technically, the light crude oil price trades within a descending channel formation in the 60-minute chart. However, the 14-hour RSI has recently bounced back to recover from oversold conditions.
Therefore, the bulls will look to stretch the latest rebound towards $106.41 or higher to $110.69. On the other hand, the bears will look to pounce on profits at about $98.17 or lower at $93.57.
WTI Crude Oil Technical Analysis (the Daily Chart)
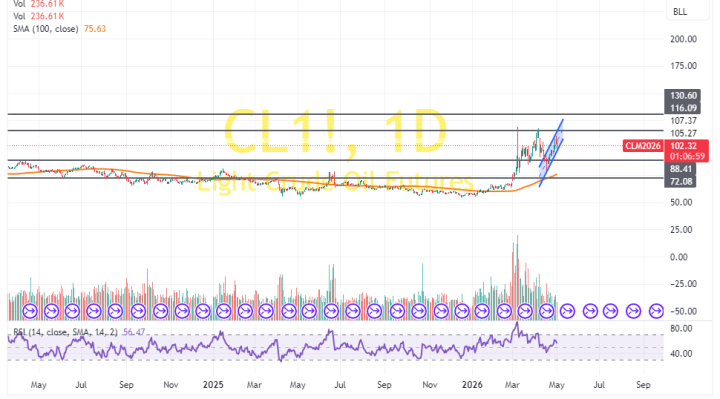
In the daily chart, the WTI crude oil price trades within an ascending channel formation. The 14-day RSI also supports a long-term bullish bias as it edges closer to overbought conditions.
Therefore, the bulls will look to ride the current run of gains towards $116.09 or higher to $130.60. On the other hand, the bears will look to pounce on profits at about $88.41 or lower at $72.08.

Comments
Log in or sign up to join the conversation.