


Natural gas is stalling below a descending trend line resistance that connects the lower highs formed since late June, as the commodity struggles to build on its recent bounce off the $2.700 mark.
Price is currently hovering around $2.770, just under the falling trend line, after failing to sustain a break higher earlier this week. A pullback from current levels could see sellers take control once more, especially if the descending trend line continues to cap upside attempts.
The Fibonacci extension tool points to where the next support levels could be found if the downtrend resumes. The 0.382 level lines up at $2.696, followed by the 0.5 level at $2.658.
A deeper selloff could drag price down to the 0.618 Fib at $2.620, with the 0.764 level at $2.573 marking the next area of interest. The 100% extension near $2.497 could be the line in the sand for a larger bearish move, roughly matching the swing low.
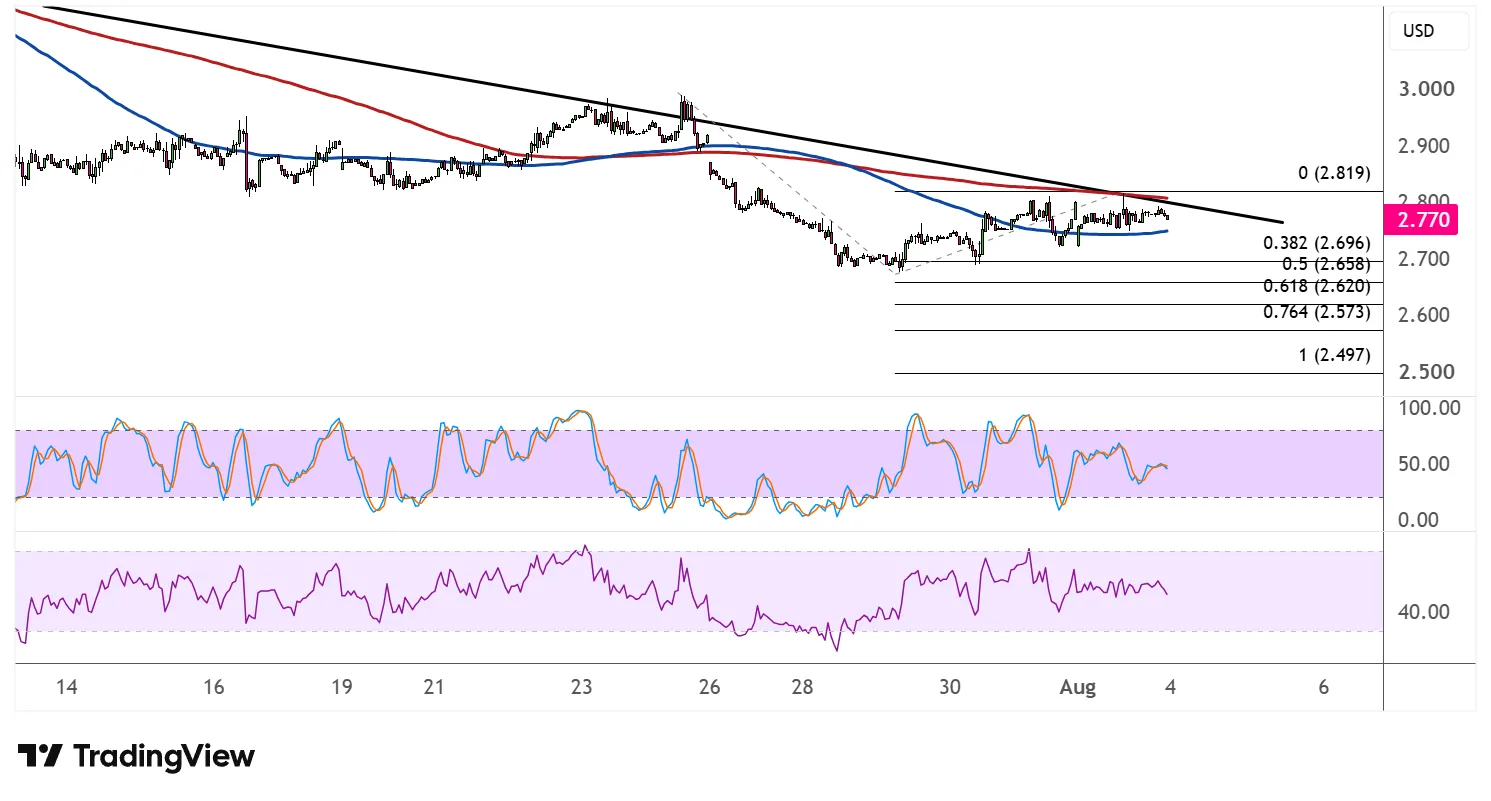
On the moving average front, the 100 SMA is now above the 200 SMA and has curled higher, hinting that a bullish crossover could still be brewing. However, price is having a hard time clearing both indicators and the descending trend line all at once, which keeps the broader bias tilted to the downside for now.
Stochastic is turning lower from the overbought region, suggesting that bullish momentum is fading and that a return of selling pressure could be underway. The oscillator has plenty of room to fall before reaching oversold territory, meaning the slide could persist for a while.
RSI is holding near the 40-50 zone and appears to be flattening out, showing that neither buyers nor sellers have a firm grip yet. If the indicator turns lower alongside price rejecting the trend line, it could reinforce the case for a move toward the lower Fib extension targets.



Comments
Log in or sign up to join the conversation.