

WTI crude oil appears to be carving out an inverted head and shoulders pattern on the short-term time frame, with the formation hinting that a bullish reversal from the recent downtrend could be underway.
Price has been recovering from the head low near $87.50 and is currently testing the neckline resistance around the $94.50–$95.00 area, with a confirmed breakout potentially opening the door to a measured move rally.
The measured move target from the pattern is estimated around the $101.00–$102.00 area, which also coincides with the 100 SMA dynamic resistance zone. A sustained close above the neckline would likely draw in more buyers and add conviction to the bullish case.
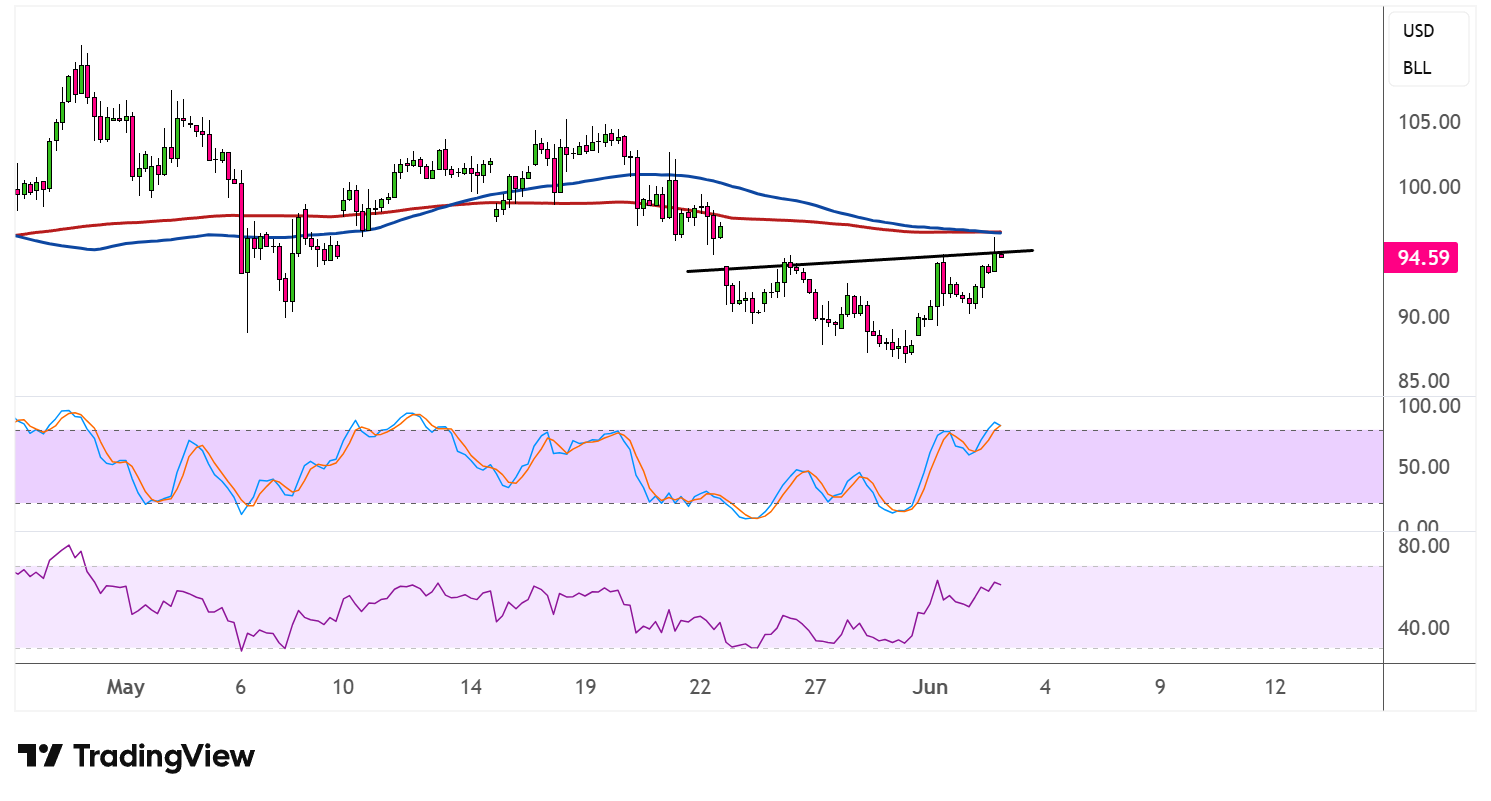
However, the 100 SMA is still below the 200 SMA to suggest that the path of least resistance remains to the downside, or that the broader bearish bias hasn’t fully reversed. Both moving averages are sloping lower and converging near the $97.00–$99.00 area, which could serve as a formidable resistance zone should price attempt to push higher.
The descending channel drawn from the late May highs also has price pressing against its upper boundary, reinforcing the neckline as a critical level to watch. A decisive break above this confluence could confirm that sellers are losing their grip.
Stochastic has surged from the oversold zone and is now approaching the overbought region, reflecting a strong return in buying pressure. A sustained move above the upper band would suggest that bulls are firmly in control, though a pullback from overbought levels could stall the rally temporarily.
RSI has similarly climbed sharply and is approaching overbought territory, leaving limited room for further upside momentum in the near term without a brief consolidation first.
Resurfacing geopolitical tensions appear to providing a tailwind for crude oil, as the prospect of talks breaking down and the Strait of Hormuz staying closed for much longer could bring extended supply risks.
Comments
Log in or sign up to join the conversation.