


WTI crude oil appears to be breaking out of a lengthy symmetrical triangle pattern that has been forming since the March highs, with price recently pushing above the upper trend line near $90.00 to test the $94.44 area.
This breakout suggests that an uptrend of the same height as the triangle formation could follow, potentially setting the stage for a fresh leg higher.
The 100 SMA has crossed above the 200 SMA, confirming that the path of least resistance has shifted to the upside or that the rally is more likely to gain traction from here. Price is also holding above both moving averages, which could reinforce their role as dynamic support on any pullback toward the triangle’s upper boundary or the apex near $83.00.
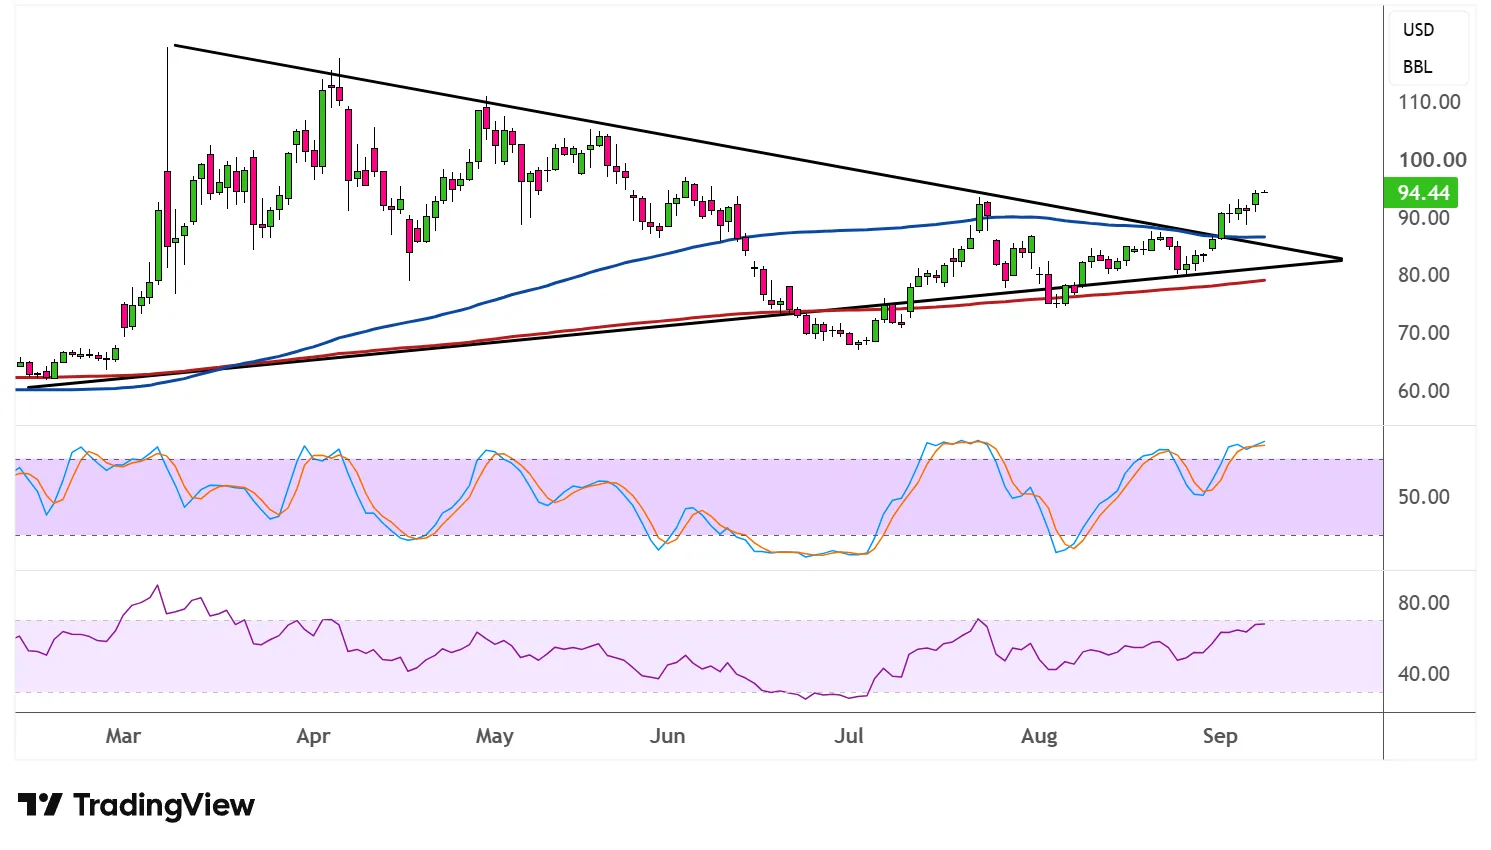
Stochastic is already in the overbought region, reflecting strong bullish momentum, though this also raises the risk of a near-term pullback or consolidation before the climb resumes. RSI, meanwhile, is also approaching overbought territory but still has a bit of room before hitting extreme levels, suggesting that buyers could remain in control for now.
Crude oil’s breakout is unfolding against a backdrop of escalating geopolitical tensions, which have historically been a catalyst for supply disruption fears and risk premiums in the energy complex.
If tensions continue to ratchet higher, this fundamental driver could align with the technical breakout to fuel a more sustained rally, possibly pushing WTI toward the $100.00 psychological level or the measured move target derived from the triangle’s widest point near March’s highs.
On the other hand, a failure to hold above the broken triangle resistance could see price slip back inside the pattern, opening the door to a retest of the $83.00 apex or the rising moving averages before buyers attempt another push higher. For now, the combination of a confirmed breakout and supportive fundamentals keeps the bias tilted to the upside.



Comments
Log in or sign up to join the conversation.