


Gold: Major Breakdown Below $4,000 Prints New Lower Swing Low
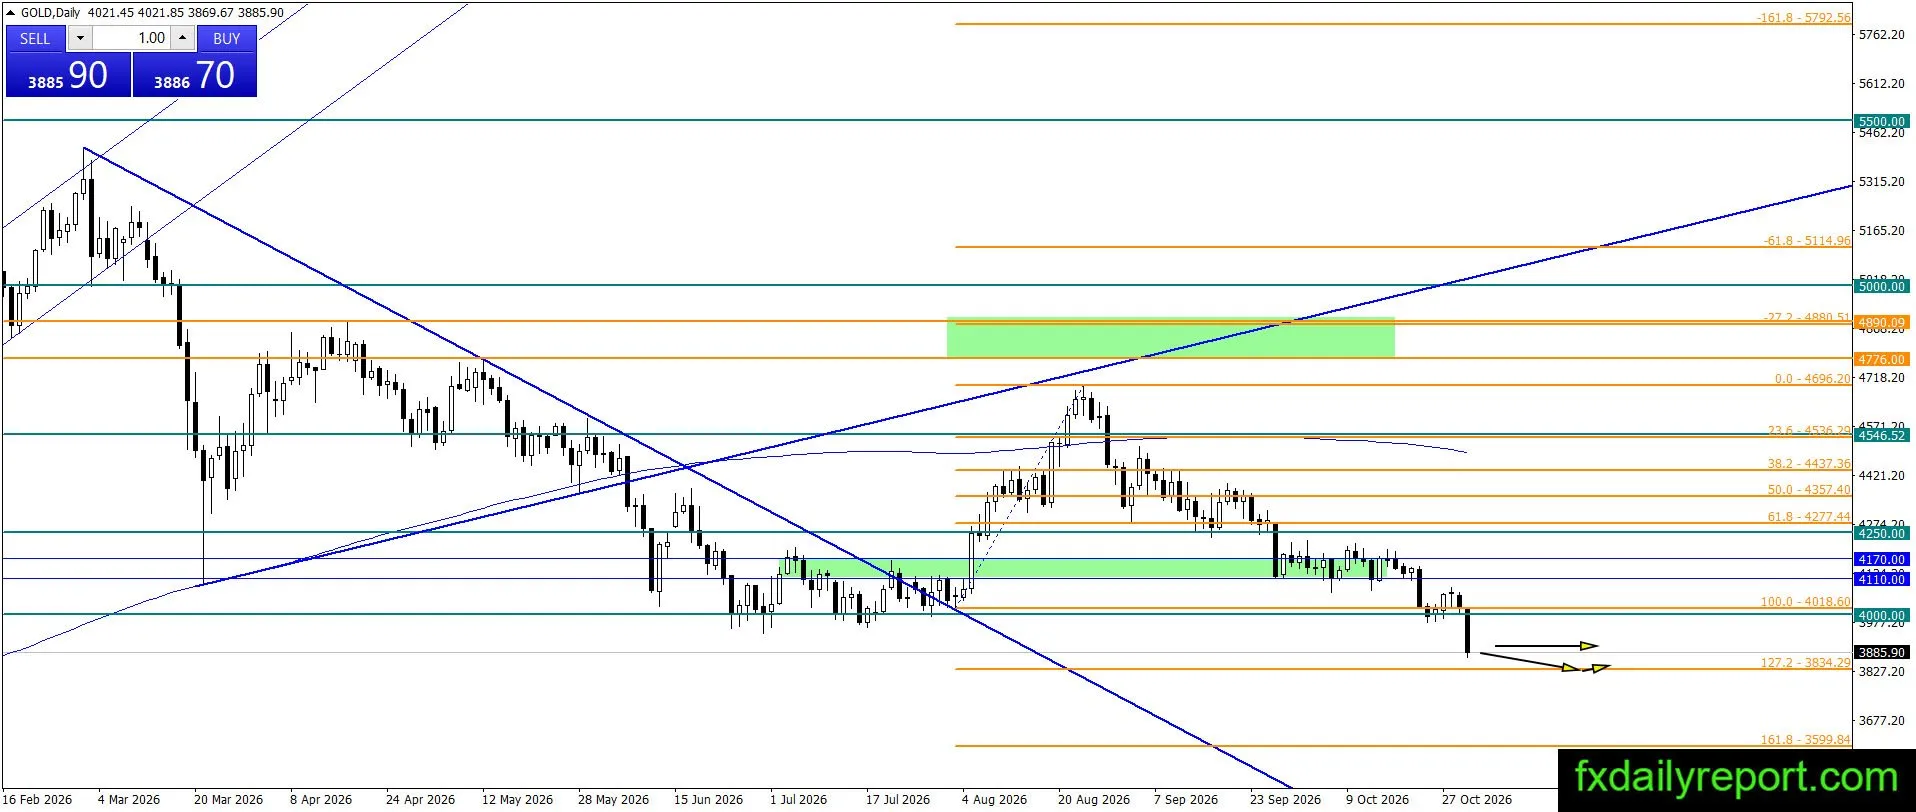
Gold experienced a major breakdown below the $4,000.00 ($4,018.60) psychological mark, printing a new lower swing low as selling pressure accelerated. Price action pushed lower toward the 127.2% Fibonacci extension target near $3,834.29. Under current market conditions, bears remain in complete control, and traders are advised to avoid long positions until clear signs of structural stabilization emerge. On the upside, any minor pullbacks will likely encounter heavy dynamic resistance around the $4,000.00 handle and the former green box support boundary ($4,110 – $4,170).
Today’s critical levels to watch:
Support: $3,900
Resistance: $4,000, $4,250, $4,350
Silver: Breakdown Below $54.00 Drives Price Sub-$50.00
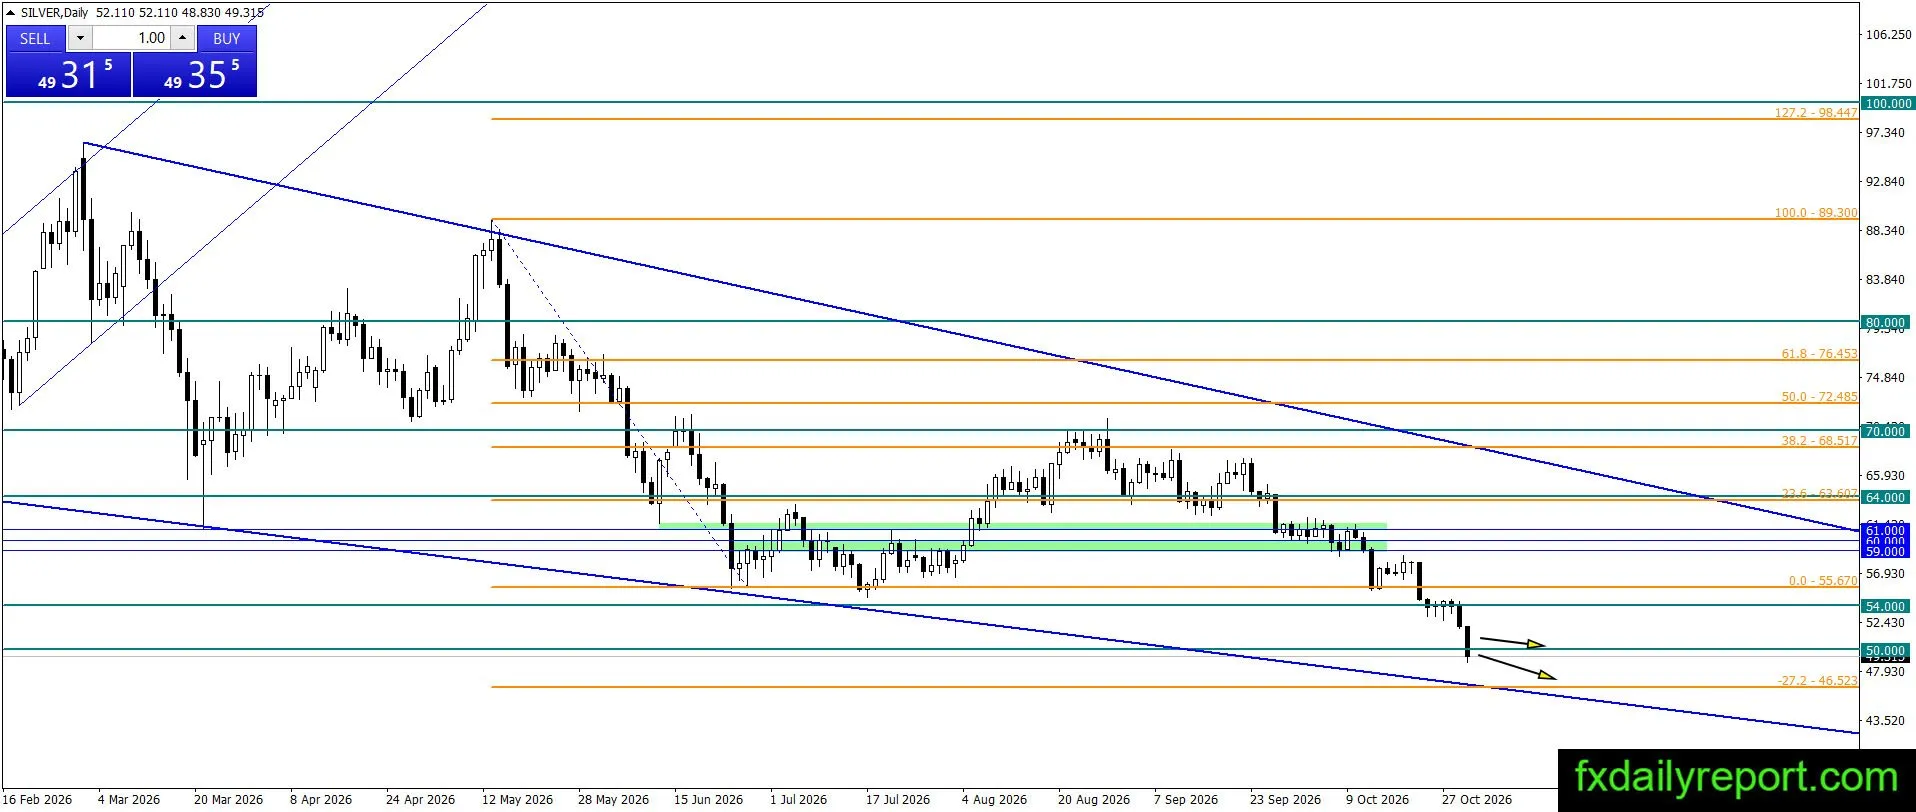
Silver’s breakdown and continuation below $54.00 immediately dragged prices beneath the $50.00 psychological mark without showing signs of stalling or reversal. Strong bearish momentum continues to dominate, indicating that traders holding short positions from above $54.00 will likely continue holding. If the sell-off extends further, price action will eye the next Fib extension region around $46.52. On the upside, $54.00 now serves as primary resistance for any corrective retracement.
Today’s critical level to watch:
Support: $50.00
Resistance: $54.00, $59.00
Crude Oil: Reaches New Higher High Before Pulling Back
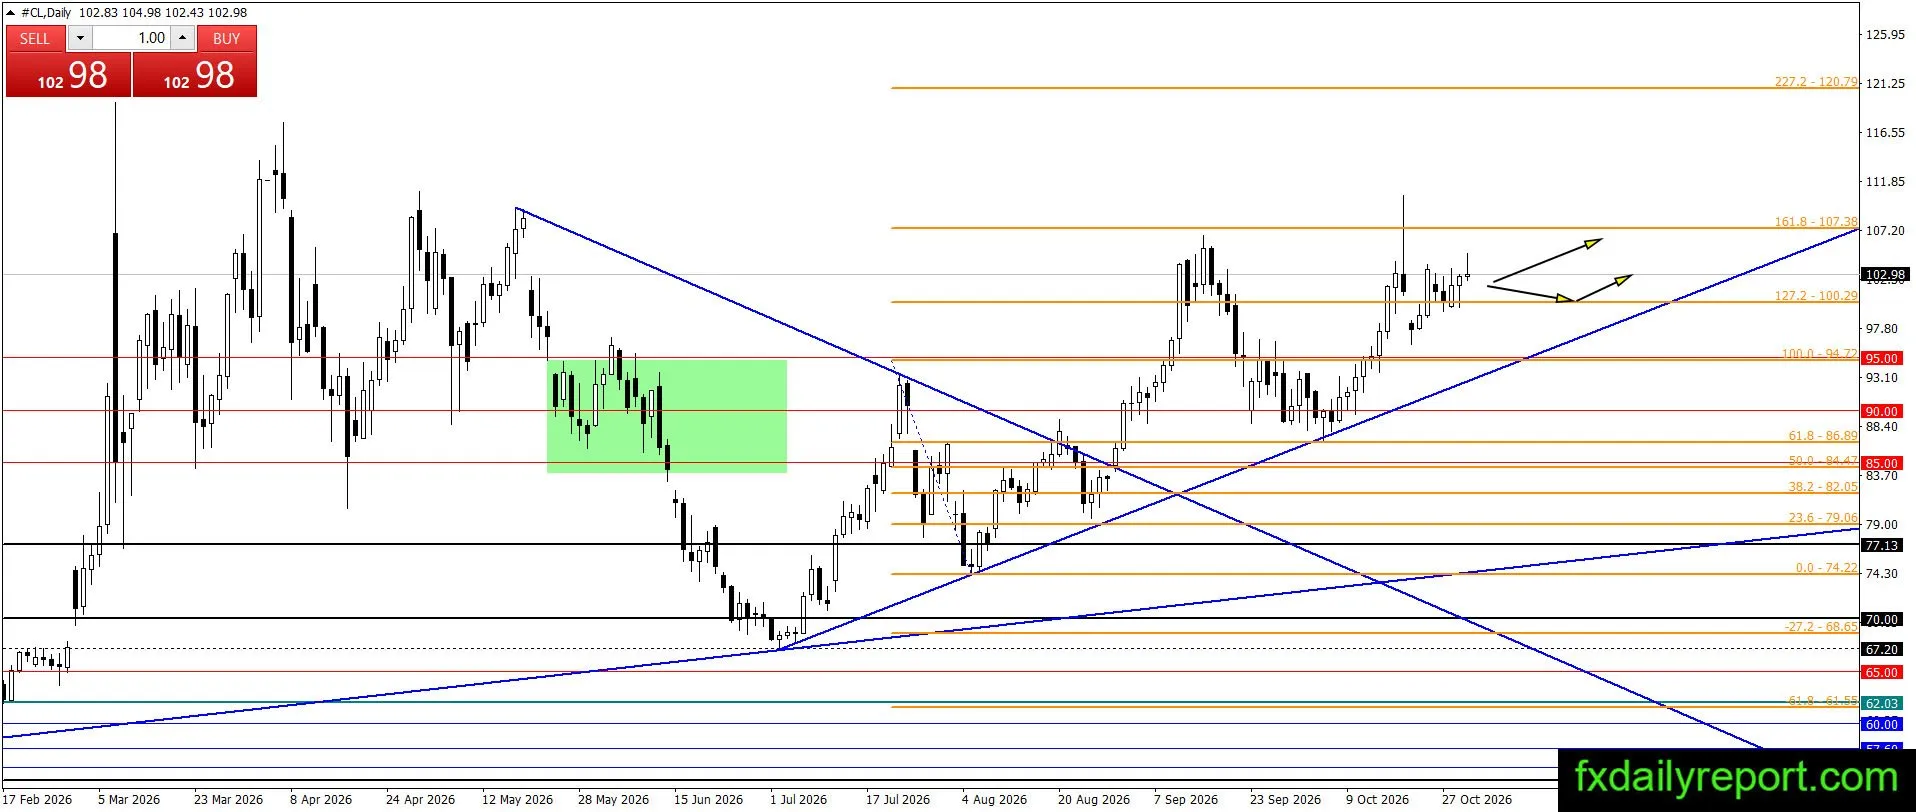
Crude oil printed a fresh higher high during intraday trading before pulling back toward its opening level. Despite the intraday retracement, the primary trend remains firmly pointed to the upside. Buyers continue to treat each bearish correction as an opportunity to add to long positions as long as prices hold above key technical supports. On the downside, the primary ascending trendline and the $100.00 ($100.29) level serve as the main support boundaries to maintain the broader bullish structure.
Today’s critical level to watch:
Support: $100.00, $95.00, $90.00, $85.00, $80.00
Resistance: $110.00


Comments
Log in or sign up to join the conversation.