

WTI crude oil has carved out a descending triangle pattern on the short-term time frame, as lower highs continue to press down toward the horizontal support floor around the $100.66 level.
This type of formation typically signals a bearish bias, warning that a breakdown below the base could open the door to a deeper correction.
If sellers manage to push the price below the triangle floor, WTI crude oil could slide toward the 50% Fibonacci retracement level at $94.97, followed by the 61.8% Fib at $91.20. A more severe selloff could even drag the price all the way down to the 100% Fibonacci level at $79.00, which lines up with a major longer-term support zone.
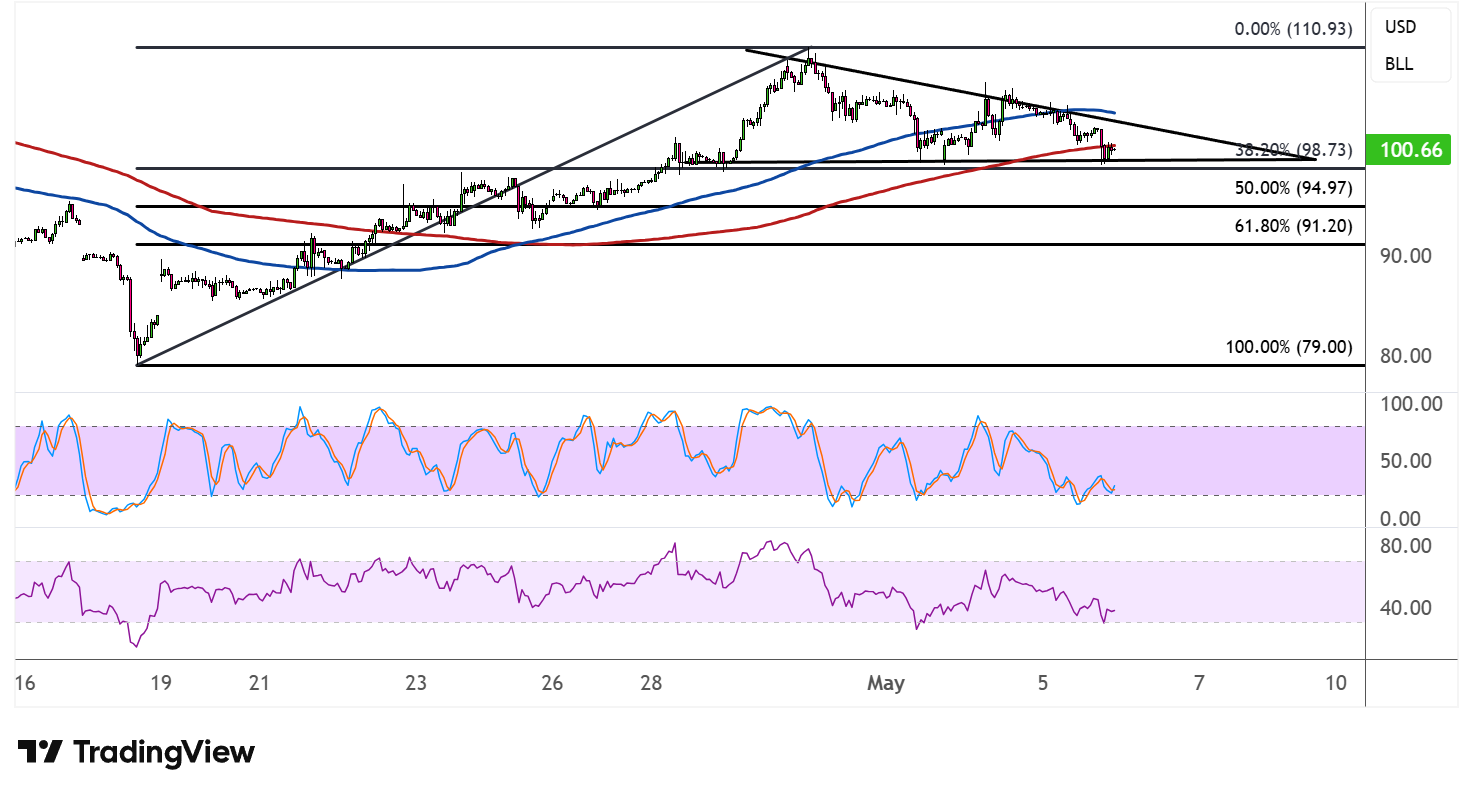
The 100 SMA has crossed below the 200 SMA, suggesting that the path of least resistance is tilting to the downside and that bearish momentum could be gaining traction. Price is also trading below both moving averages, reinforcing the notion that sellers currently have the upper hand.
However, stochastic is approaching the oversold region after an extended slide, suggesting that selling pressure could be starting to exhaust. If the oscillator turns higher from current levels, it could signal a return of buying interest that pushes price back toward the descending trendline resistance or even the 38.2% Fibonacci retracement at $98.73.
RSI is similarly deep in bearish territory and nearing oversold conditions, so a bounce from the triangle floor remains possible. A convincing close above the descending trendline, backed by strong bullish candlesticks, could invalidate the bearish pattern and put the swing high near $110.93 back in focus for determined bulls.
WTI crude oil could also take directional cues from geopolitical developments in the Middle East, OPEC production decisions, and weekly API and EIA inventory reports. A surprise draw in stockpiles or fresh supply disruption headlines could be enough to breathe life back into the bulls and trigger a breakout to the upside.

Comments
Log in or sign up to join the conversation.