
Wisconsin private nonfarm payroll employment only 112.6 thousands (45%) below Governor Walker’s goal of 250,000 net new jobs.
With the January 2015 release of the establishment employment series, figures were benchmarked to incorporate new data (press release). The new figures erase the surge in estimated employment registered in the last few months of 2014.
Below are nonfarm payroll employment and private nonfarm payroll employment, from the December 2014 and January 2015 releases.
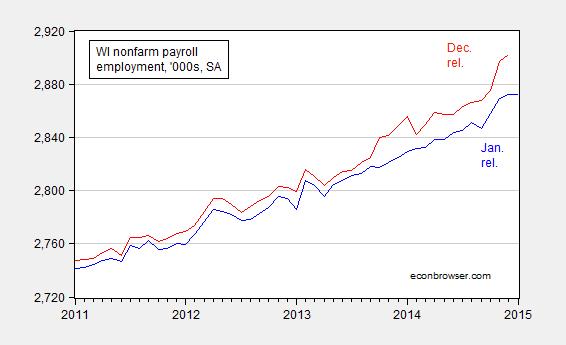
Figure 1: Wisconsin nonfarm payroll employment, in thousands, seasonally adjusted, from January 2015 release (blue), and from December 2014 release (red).
Source:Wisconsin DWD.
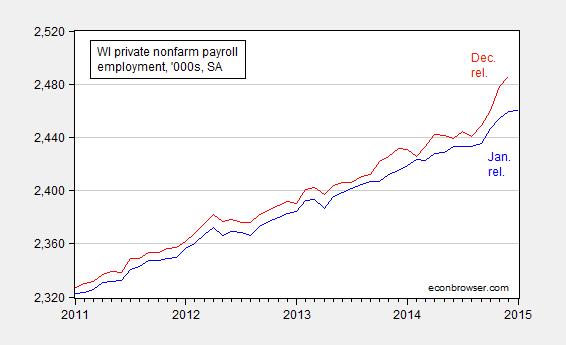
Figure 2: Wisconsin private nonfarm payroll employment, in thousands, seasonally adjusted, from January 2015 release (blue), and from December 2014 release (red).
Source:Wisconsin DWD.
The downward revisions are particularly marked in the latter part of 2013, starting with 2013Q4. In addition, according to the preliminary estimates, the Wisconsin economy only created 300 private nonfarm jobs in January.
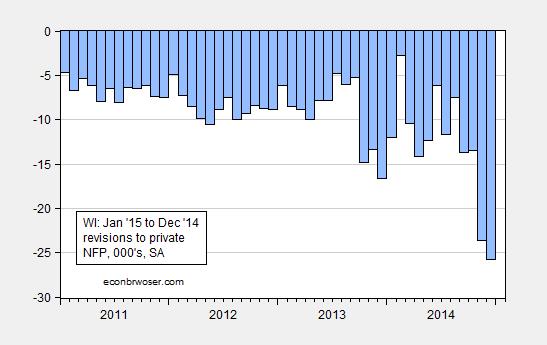
Figure 3: Revisions in Wisconsin private nonfarm payroll employment, in thousands, seasonally adjusted, from January 2015 release relative to December 2014 release.
Source:Wisconsin DWD, and author’s calculations.
These large downward revisions reflect the new information associated with the Quarterly Census of Employment and Wages (QCEW), which as readers will recall was the data set the Walker Administration was for … before it was against (or at least indifferent to). As I discussed in this post, the estimated employment series was likely to be revised down through September 2014. The downward revisions for October 2014 and thereafter reflect both the QCEW data through 2014M09 and additional information that has come in.
With these new figures, and using the revised series to calculate the new trend required to hit Governor Walker’s August 2013 promise to hit 250,000 new jobs, the January 2015 shortfall is 112.6 thousand.
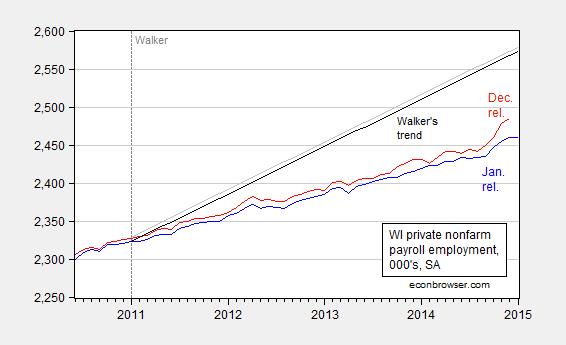
Figure 4: Wisconsin private nonfarm payroll employment, in thousands, seasonally adjusted, from January 2015 release (blue), and from December 2014 release (red), and trend required to achieve Governor Walker’s August 2013 promise to add 250,000 net new jobs, from 2014 series (gray), and from 2015 series (black).
Source: Wisconsin DWD, and author’s calculations.
Note that when the BLS series (which typically match the DWD series) are released on March 17, then the Philadelphia Fed coincident indices will be revised to incorporate these downwardly revised employment series. Ceteris paribus, this outcome implies that the Philadelphia Fed coincident index will be revised downward, since the establishment employment series (NFP) and the hours worked in manufacturing are two of the four components of the index. This might prove a cautionary note for those who normalize to a time period very close to when the benchmark revision occurs (e.g., here, which uses a normalization date of 2013M07), if the comparisons of employment series are any indication.


Comments
Log in or sign up to join the conversation.