

Having just looked at the expected earnings future for the S&P 500 (Index: SPX) at the midpoint of 2022-Q1, it's time to turn our attention to the more important expectations for the S&P 500's dividends per share. The following chart shows those expectations as of Friday, 18 February 2022:
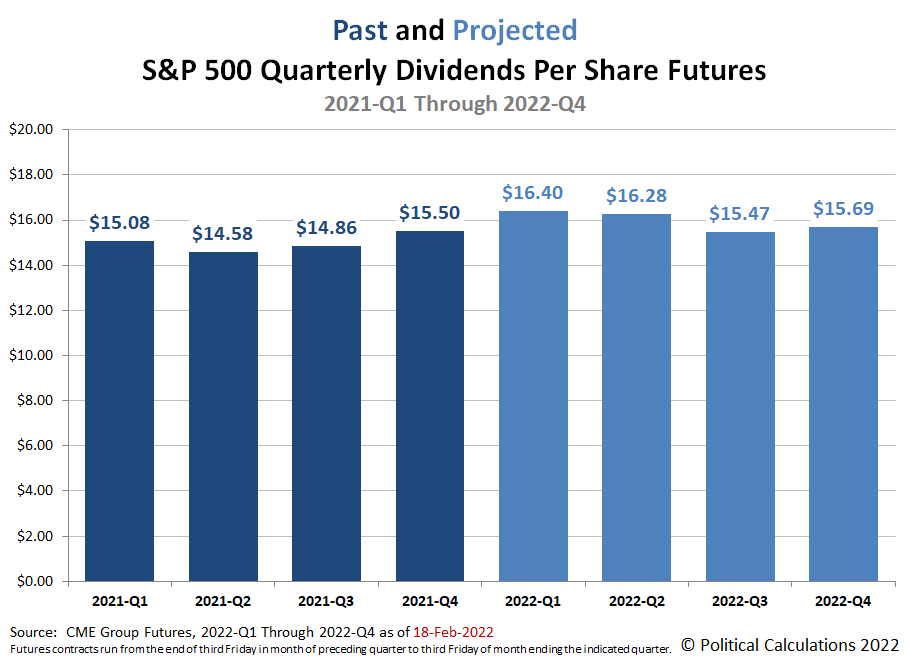
Here's a quick summary of how these future expectations have changed for each quarter in 2022 since our last snapshot three months ago:
- 2022-Q1: Up to $0.20 per share
- 2022-Q2: Up to $0.74 per share
- 2022-Q3: Down $0.04 per share
- 2022-Q4: Up to $0.18 per share
These changes reflect a generally improving outlook for S&P 500 dividends over the past three months, though we should caution that the underlying dividend futures data has been uncharacteristically volatile in recent weeks.
More About the Numbers
Dividend futures indicate the number of dividends per share to be paid out over the period covered by each quarters dividend futures contracts, which start on the day after the preceding quarter's dividend futures contracts expire and end on the third Friday of the month ending the indicated quarter. So for example, as determined by dividend futures contracts, the "current" quarter of 2022-Q1 began on Saturday, 18 December 2021, and will end on Friday, 18 March 2022.
That makes these figures different from the quarterly dividends per share figures reported by Standard and Poor, who reports the number of dividends per share paid out during regular calendar quarters after the end of each quarter. This term mismatch accounts for the differences in dividends reported by both sources, with the biggest differences between the two types seen in the first and fourth quarters of each year.
Reference
The past and projected data shown in this chart are from the CME Group's S&P 500 quarterly dividend index futures. The past data reflects the values reported by CME Group on the date the associated dividend futures contract expired, while the projected data reflects the values reported on 18 February 2022.
Comments
Log in or sign up to join the conversation.