
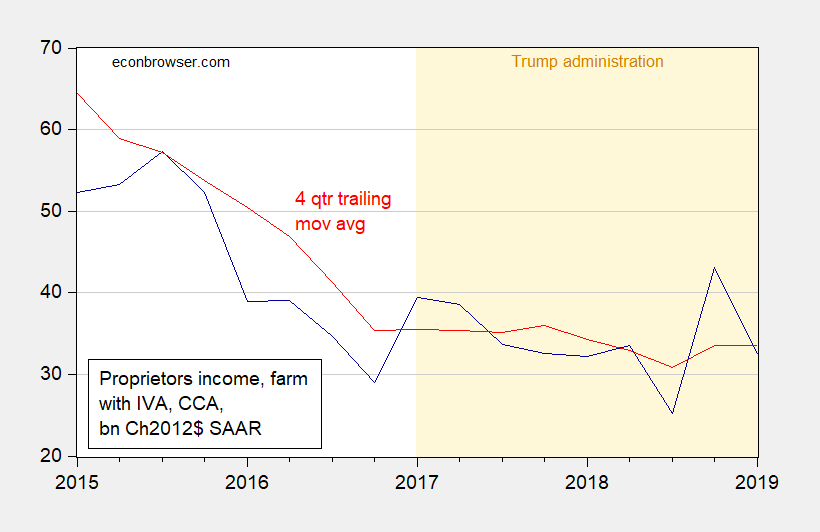
Figure 1: Real proprietor farm income with inventory valuation adjustment and capital consumption allowance (dark blue), and 4 quarter trailing moving average (red), both in billions of Ch.2012$, SAAR. Deflated using GDP deflator. Source: BEA 2019Q1 advance release, and author’s calculations.


Comments
Log in or sign up to join the conversation.