

We are still in a hunt for a low but there is evidence that markets are finding some consolidation around recent price action - even if the range from high to low for this range is around 10%.
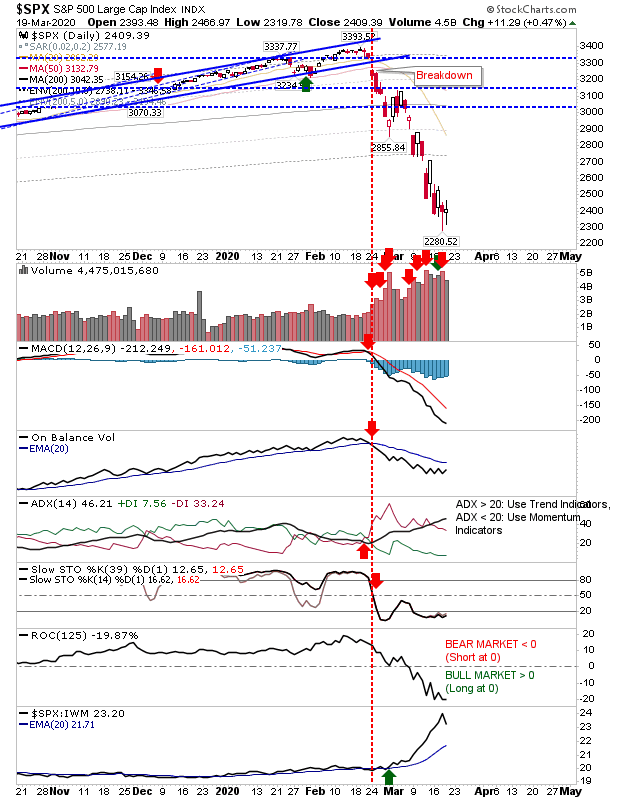
The S&P finished with a bullish hammer on Wednesday on a high volume day, today was more of an indecisive 'spinning top' on lighter volume. The S&P is trading 20% below its 200-day MA but a bounce is needed; however, nobody knows when this bounce will emerge. Technicals are not offering much guidance yet.
(Click on image to enlarge)
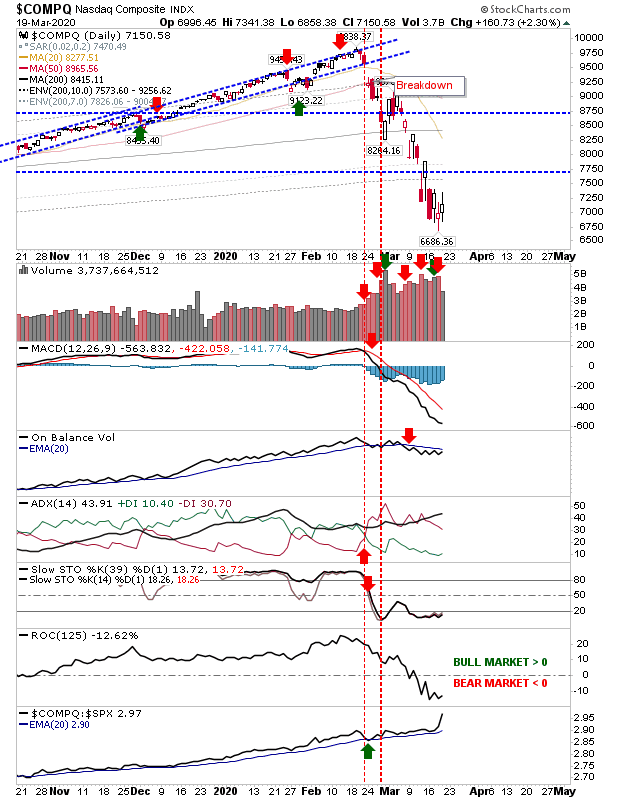
The Nasdaq experienced a big volume day on yesterday's bullish hammer, but today's buying saw a significant drop in traded volume. The index low is not there yet.
(Click on image to enlarge)
The bullish reaction in the Nasdaq Bullish Percents has delivered a 'bull cross' in the 5-day EMA with a 'buy' trigger in CCI.
(Click on image to enlarge)

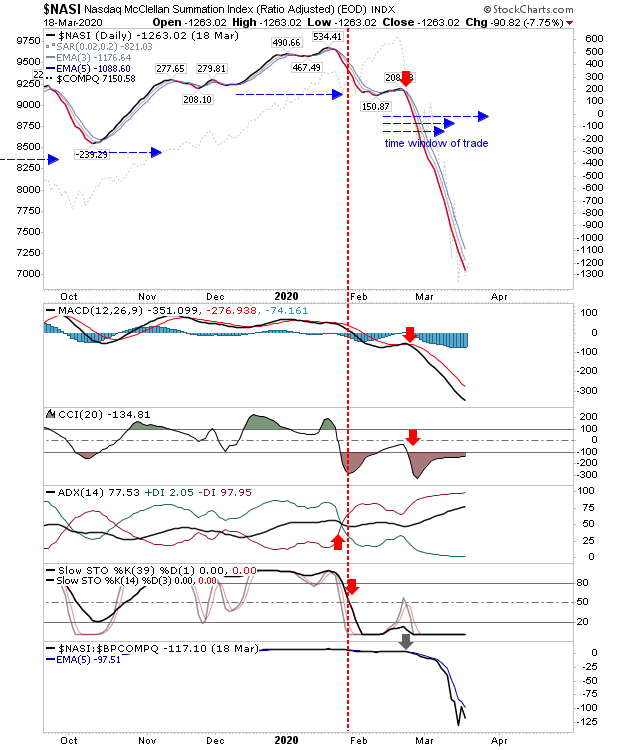
However, the Nasdaq Summation Index - an index which gives clear signals (a cross of the 5-day EMA); the arrows mark this trade here - is heavily oversold but hasn't yet marked a swing low by flattening or turning higher
(Click on image to enlarge)
Some may argue the Russell 2000 has completed a 'tweezer bottom' but I don't think there is enough there to consider it at one. Volume has climbed over the last couple of days but the candlesticks aren't suggesting a low is in place.
(Click on image to enlarge)

Markets are still looking to establish an initial swing low and we can't say much about a recovery until we have seen some semblance of a bottom. Given the total amount and speed of the decline, the recovery is likely to take a long time and it will likely be years before we get to see January highs tested again.



Comments
Log in or sign up to join the conversation.