


Drone strikes disabled Saudi Arabia’s East-West pipeline – the last major bypass route around the blocked Strait of Hormuz. We break down the mechanics of the event and three scenarios for WTI, Brent, XAU/USD, and US indices.
What Happened
On Wednesday, September 16, the Fed raised the rate by 25 bps to 3.75-4.00% – the first hike since 2023, and the decision was unanimous. The dot plot (SEP) shifted: the median for end‑2026 rose from 3.80% to 4.10%, which, at the current range, is equivalent to signaling one more hike before year‑end. Sixteen out of eighteen committee members expect at least one more increase ahead, and only two believe the rate will stay unchanged. In essence, this fully reverses the three rate cuts made in 2025 under former Fed Chair Jerome Powell.
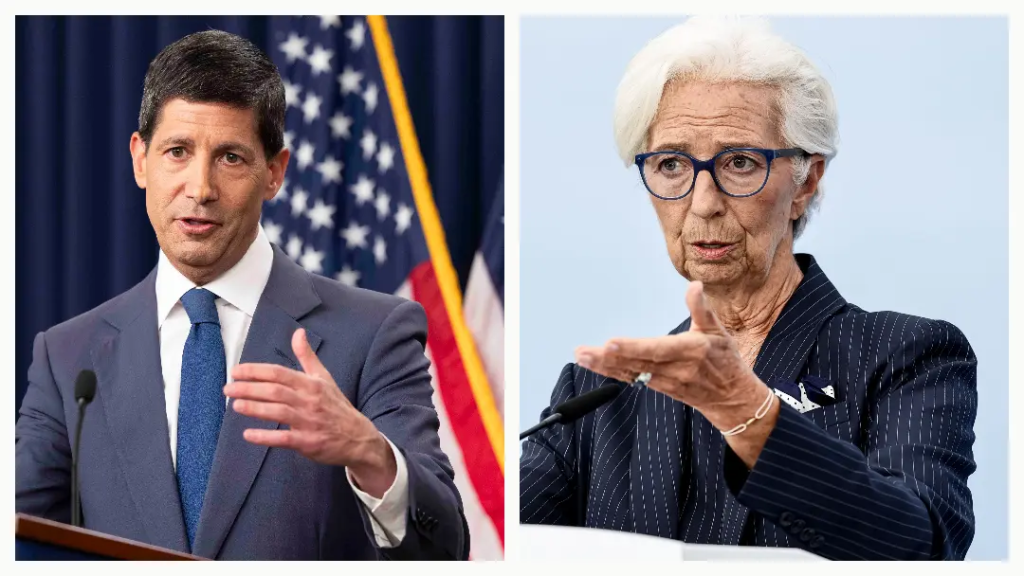
New Chair Kevin Warsh, speaking at the press conference, talked about a “timely return” to the 2% target and insisted that the underlying inflation trend “has not shown meaningful improvement.” Markets reacted sharply: the Dow lost 631 points (-1.21%), the S&P 500 fell -0.45%, while the Nasdaq held almost flat (-0.01%) – the tech sector proved more resilient than the broader market. The dollar index (DXY) jumped +0.6% to its highest level since July 31. Gold fell intraday to $4,220, closing the session at -1.6%.
Why This Was Unexpected
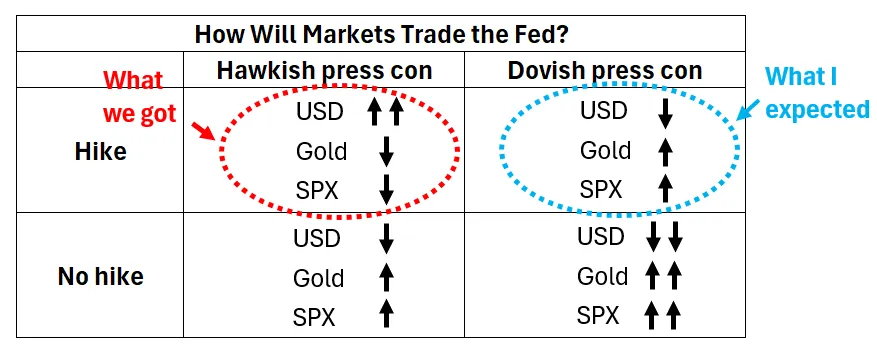
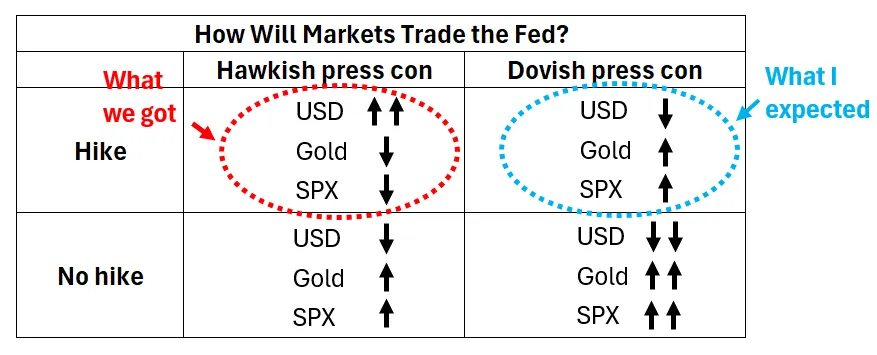
Analyst Robin J. Brooks, in his post “I Was Wrong About Kevin Warsh,” directly admitted a prediction mistake: he expected a hike, but a “dovish” one – with disagreements among committee members and cautious forward signals. The opposite happened: a unanimous decision and dots for 2027 hinting at continued tightening. In his own illustration, Brooks divides possible outcomes into four quadrants – he expected the upper‑right quadrant, but we ended up in the upper‑left.
Warsh was asked at the press conference exactly what Brooks considered the key question: what changed since July 29, when his tone was soft. The answer – economic growth, an insufficiently fast inflation slowdown, and a new round of geopolitics. Brooks calls this “a narrative, not a framework”: Friday’s CPI, in his reading, was distorted by one‑off price spikes, and without them core inflation is slowing quickly; the geopolitical shock itself (the oil spike) occurred before the July meeting and therefore does not explain the reversal happening right now.
Brooks’s own explanation is sharper: he believes the real reason for the reversal is the jump in long‑term bond yields after July 29. Another dovish appearance would have been politically impossible, because the market would read it as a loss of control over the long end of the curve. In his view, the hawkish narrative is not an end in itself but a tool to keep yields “anchored”; therefore, the Fed’s rhetoric may change sharply depending on circumstances rather than according to a fixed rule. Brooks is also skeptical about the unanimity and the overall shift in the dots – he assumes that some of the committee’s “hawks” would have remained dovish under Powell, and that the current toughness is partly about demonstrating independence from the White House and personally from Warsh.
This Is Broader Than Just the Fed
The ECB went through a similar path earlier: the hike on June 11 (the first since 2023, deposit rate 2.25%), a pause in July with a clear hint at September, and a second hike on September 10 – to 2.50%. Lagarde called the decision a “no-brainer” and “robust” across all three scenarios the bank has laid out for the region. ING analysts, in their piece “Why we’ve changed our Fed and ECB calls,” state that both banks deviated from the dovish path they had previously assumed, and now ING expects one more hike from each by year‑end.
The structure of the rates market is telling: the spread between the overnight rate and the yield on 2‑year bonds (“carry spread”) – a rough indicator of how many hikes or cuts the market prices in for the next two years. At neutral levels, it is around 30 bps; now the ECB is at 65 bps, the Fed at 75, the Bank of England at 90, the Bank of Japan at 95 – the market is pricing further tightening by all four major central banks, not just the Fed. At the long end, the same picture: the yield on 10‑year US Treasuries broke above 5% for the first time since 2023 (intraday – the highest since 2007), then pulled back slightly after the Fed decision, but ING believes upward pressure on long‑term rates will persist in the coming months – not only in the US, but also in the eurozone, Japan, and U.K. government bonds.
What This Means for Traders
The main lesson of this week is that a decision almost never moves the market as much as guidance does. A 25 bps hike was priced in at 90%+ according to CME FedWatch, so 10‑year yields were rising in the days before the meeting, and after the decision itself they declined: uncertainty was removed, and that is already a “bought fact.” What moved the market were the SEP dots and Warsh’s tone at the press conference. This means that around upcoming Fed and ECB meetings, the key risk point is not the rate number itself, but the language of the accompanying statement and the dot plot.
The second point is the divergence between the Dow and Nasdaq on the same day. This is not a classic risk‑off “sell everything,” but rotation: capital leaves rate‑sensitive and dividend stories but stays in names with strong internal growth drivers. For CFD indices, this means that the reaction to rate news may be selective across instruments rather than uniform.
Three Scenarios
Base Scenario
Triggers: inflation data before the December meeting come in line with expectations, the Fed and ECB deliver one more hike each by year‑end, as priced in the SEP and ING’s outlook.
XAU/USD – volatile but generally pressured range – new local lows toward $4,100-4,200 are possible on each hawkish Fed speaker, but structural demand (central bank buying) limits the depth of declines.
DXY and FX – the dollar retains support, but a synchronous ECB hike narrows the rate differential – DXY may move more moderately than in a divergent‑policy scenario; USD/JPY tends upward due to the Bank of Japan’s lower carry spread.
US indices – selective duration pressure – US30/US500 more vulnerable than US100 as long as the tech sector shows its own growth.
Core Inflation Genuinely Slows
Triggers: upcoming CPI/PPI reports confirm Brooks’s thesis that the spike was a one‑off and the underlying inflation trend is lower than the Fed assumes; the December hike comes into question.
XAU/USD – reversal upward on repricing of the rate trajectory – return to $4,400-4,500+ and higher, especially if it coincides with dollar weakness.
DXY and FX – correction downward, EUR/USD and GBP/USD rebound on reduced expected rate differentials.
US indices – relief for growth stocks – repricing of discount rates supports US100 first and foremost.
The Long End Breaks Again
Triggers: US 10‑year yields confidently break above 5% again and continue rising – not due to economic strength, but due to deficit/supply of government debt (term premium); the effect spreads to the eurozone, Japan, and U.K. government bonds.
XAU/USD ambiguous: a short impulse down from rising real rates, but if the market reads this as a risk to confidence in government debt (“debasement trade”), gold can turn upward despite hikes – this is exactly the scenario some year-end outlooks already price in ($5,000-6,000 versus the consensus $4,500).
US indices – the most vulnerable scenario for long‑duration equities – a sharp rise in the cost of capital hits US100 multiples first, and a spike in volatility across all three indices is likely.
DXY and FX not guaranteed bullish for the dollar: if rising yields are read as fiscal risk rather than economic strength, the dollar may weaken simultaneously with rising yields – an atypical but already observed pattern in 2025-2026.
Summary of Economic Projections (SEP), also known as the “dot plot,” is the anonymous individual estimates of each FOMC member for the policy rate at the end of the current and future years, published four times a year together with the rate decision. What matters is not the current rate, but the shift in the median between meetings – that is what moves the market more than the decision itself. Carry spread is the difference between the overnight rate and the yield on 2‑year bonds: a rough but quick estimate of how many hikes or cuts the market has already priced in for the next two years. A level around 30 bps is considered roughly neutral; anything noticeably higher is the market premium for expected hikes.
Counterpoint
Skepticism is appropriate in both directions. Brooks himself caught his own prediction mistake literally the day before – it is worth keeping in mind that his “yield‑anchoring theory” is also a hypothesis, not a confirmed fact. On the other hand, gold has already shown that it is ready to absorb hawkish surprises faster than before: after the drop to $4,220-4,263 it recovered the decline within two days, and year‑end estimates among different analysts range from $4,500 to $6,000 – a clear sign that the “debt‑driven” bullish thesis for gold (growth of government debt, political pressure on central banks, central‑bank demand) has not disappeared even under a formally hawkish Fed. A one‑sided bet on “hikes = gold down” worked in the moment, but as a multi‑month strategy it is debatable.

Comments
Log in or sign up to join the conversation.