

Over the past year, it’s seemed like all investors can talk about are SpaceX (SPCX) and chip stocks like Nvidia (NVDA) and Micron Technology (MU).
Last year, it was all Mag 7 all the time.
Investors may not have realized this − and the mainstream financial media certainly isn’t talking about it − but in the past year, small cap stocks have crushed large caps.
Since August of last year, the S&P 500, as measured by the State Street SPDR S&P 500 ETF Trust (SPY), has returned just under 23%, a terrific one-year gain. Meanwhile, the Russell 2000 small cap index, as measured by the iShares Russell 2000 ETF (IWM), rose more than 38%, a monster return.
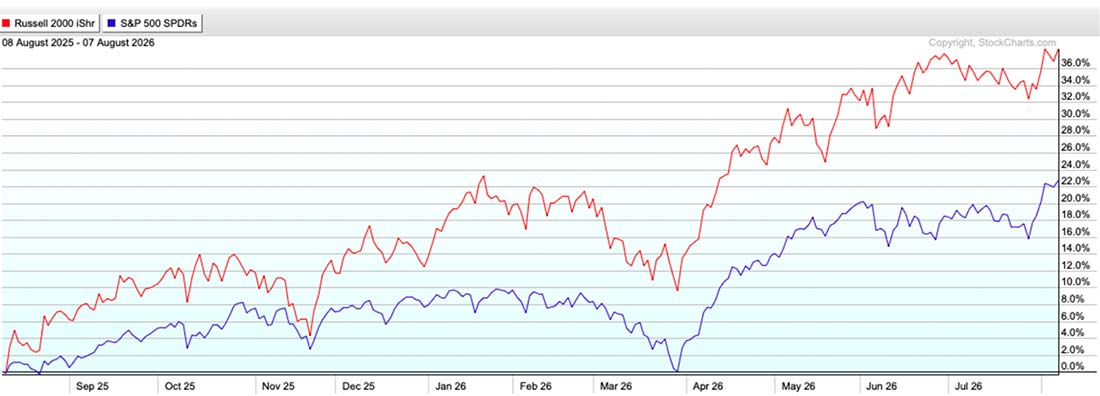
In fact, from January through June, small caps had their best first half of the year since 1991.
This is important because outperformance cycles between small and large caps often last for years. When small caps lead, the outperformance can be massive.
Consider…
Between 1958 and 1968, small caps outperformed by 713 percentage points.
Between 1939 and 1946, small caps outperformed by 874 percentage points.
Between 1973 and 1983, small caps outperformed by 947 percentage points.
Small caps’ worst underperformance was between 2013 and 2025, when they lagged large caps by 200 percentage points.
The average period of small cap outperformance lasted 8.9 years, with small caps beating large caps, 758% to 166%.
The average period of small cap underperformance lasted 6.2 years, with small caps trailing large caps, 13% to 123%.
The fact that we appear to be in a new period of small cap outperformance is great news for investors, because small cap stocks typically lead in the early to middle stages of bull markets.
It’s also a positive indicator for the economy.
Small caps often rely on economic growth, and spending in the U.S. is still strong. Since the early days of the pandemic, consumer spending has risen every single quarter.
If you subscribe to the theory that markets are forward-looking, as I do, that’s good news for American business.
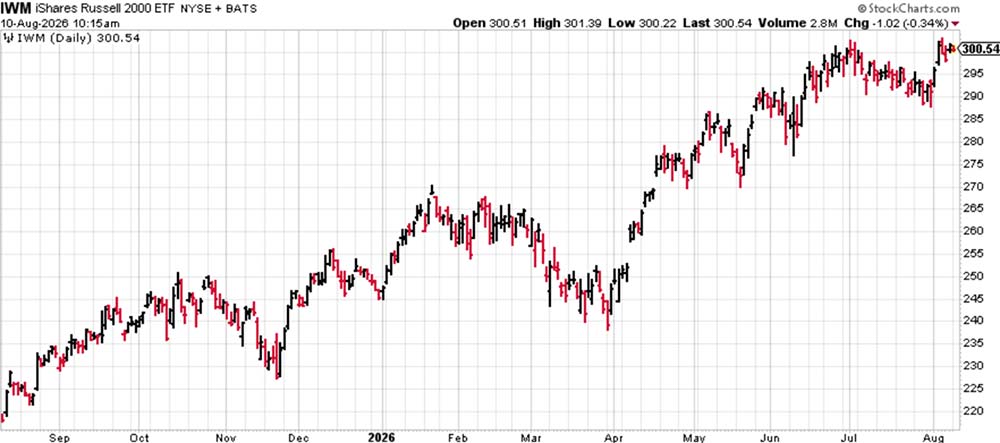
The chart of the Russell 2000 ETF looks terrific too.
For the past year, it has been climbing. Almost no stock or index goes straight up (there will always be retracements and corrections), but there is no mistaking that this chart has been going up and to the right. You could show a middle schooler this chart and ask them which direction it’s going, and they would get it right.
The most heavily weighted stocks in the Russell 2000 are Bloom Energy (BE), which provides on-site electricity for AI data centers, Credo Technology Group (CRDO), which makes a specific type of cable used in data centers, and Agilon Health (AGL), which provides technology and services for physicians.
Some more well-known names in the index include EchoStar (ECHO), which provides Dish satellite TV service, Brinker International (EAT), which owns restaurant brands Chili’s and Maggiano’s Little Italy, and pawn shop operator FirstCash (FCFS).
I expect small caps to continue to outperform larger-cap stocks in the near and intermediate term. If history is any guide, that outperformance should be quite large − several hundred percentage points.
Most investors have exposure to the S&P 500 through index funds, but if we are in a new period of small cap outperformance, you must have exposure to small caps.



Comments
Log in or sign up to join the conversation.