

XRP hit $3.65 in July 2025, its highest price of this cycle and a whisker below its all-time high of $3.84 from January 2018. Today it trades around $1.30. That is about 66% below the record and roughly 30% below where it started 2026, at $1.84. In early August it dipped to about $1.00, its weakest level since November 2024. It then bounced with the wider market in the crypto rally in August, and a September push toward $1.60 looked like a recovery before it faded.
That is hard to square with the headlines. Ripple has spent nearly $3 billion on acquisitions, launched its own stablecoin and ended its legal fight with the SEC. Yet since August 2025 XRP has fallen about 59%, against 32% for Bitcoin and 44% for Ether. So what is going on? This analysis covers four reasons XRP is weak, the price levels that matter right now, and what would tell us the selling is over.
XRP Price Analysis – Why XRP Keeps Lagging
Four forces explain why XRP has fallen further than Bitcoin and Ether, and why a steady flow of good news has not been enough to lift it.
1. The supply keeps growing
The simplest explanation is arithmetic. Circulating XRP has grown from about 38.7 billion tokens in 2017 to roughly 63 billion today, an increase of about 63%. Over the same stretch, the total market value of XRP has barely changed, down about 3% according to Nansen. When the number of tokens rises by two-thirds and the total value stays flat, each token is worth less.
That supply is not finished growing. Ripple still holds around 37 billion XRP in escrow, and it releases 1 billion every month. On 1 November another 1 billion unlocks. Ripple usually locks most of it back up, and one estimate puts the net addition at about 300 million tokens, but the market knows the overhang exists. Every rally has to absorb it.
2. Demand is thin
Spot XRP ETFs launched nearly a year ago and have collected about $1.8 billion since. That is real money, and it has picked up lately, with about $75 million arriving in a single week in late September. But it is small next to the market. Bitcoin ETFs sometimes take in more than $1 billion in one day.
Trading activity tells the same story. Nansen data cited by CoinDesk shows XRP spot volume down about 53%, perpetual futures volume down 44% and active addresses down about 11%. A token can sit still when nobody sells, but it rarely climbs when nobody buys.
3. Ripple’s success does not automatically reach the token
This is the part that frustrates holders most. Ripple the company is doing well. It has bought Hidden Road for $1.25 billion and GTreasury for $1 billion, and it runs a growing stablecoin, RLUSD. But a successful company and a rising token are different things.
Many payment flows use XRP as a bridge that is held for a few seconds, so volume can grow without anyone holding more XRP. Ripple’s own stablecoin may also take over jobs investors expected XRP to do, and some Ripple Payments products can run without XRP at all. Then there is the fee burn. The network destroyed about 24,000 XRP over the last 30 days, worth roughly $30,000, against a market value above $80 billion. It is a nice design feature. It is not a price driver.
4. The legal win was already priced in
For years the SEC case hung over XRP. In 2023 a court ruled that public-exchange sales were not securities offerings, though institutional sales were. Ripple paid a $125 million penalty in 2024, and in August 2025 both sides dropped their appeals. The uncertainty is gone.
But look at the timing. XRP hit its cycle high on 17 July 2025, weeks before that final resolution. Much of the good news seems to have been priced in before it arrived, and the market has since moved on to stories XRP does not obviously belong to, such as DeFi, AI and memecoins. Ripple has focused on payments and trade finance instead. Solana, which sits at the center of that activity, was roughly flat for 2026 in late September while XRP was down about 17%. Our Solana analysis looks at what that usage looks like.
The September rally that faded
The most recent test of all four reasons came in September. From 1 to 28 September XRP rose about 10%, from $1.38 to $1.52, slightly ahead of Bitcoin. ETF inflows picked up at the same time, from under $10 million in one week to about $75 million the next. Yet XRP topped out around 23 September and has since given back most of the move. When demand improves and the price still cannot hold its gains, it usually means supply is absorbing the buying. It does not prove the trend has turned, but it explains why traders are cautious.
Key Levels to Watch
A quick look at the chart reveals that XRP is sitting right on its 200-day average, near $1.28, which has become the line the market is arguing over. Just below it sit the 21 August low around $1.27 and the 16 September low near $1.25, which together form a support zone about three cents deep. On the upside, the 30- and 50-day averages around $1.41 to $1.44 have been the ceiling in recent weeks. The more important number is $1.84, the price at the start of the year. Until XRP closes above it, every rally can be read as a bounce inside a down year.
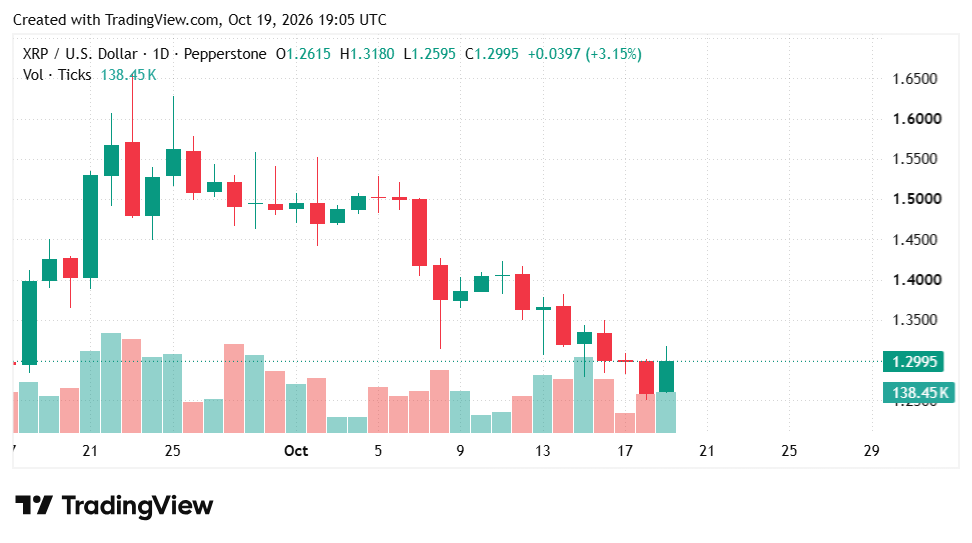
Moving forward, traders should watch the following levels. A clean daily close below $1.25 would put the August low, close to $1.00, back in play.
Support
200-day averageAlso near the 21 August low~$1.28
16 September lowThe line that decides the bounce$1.25
August low and round numberWeakest since November 2024~$1.00
Resistance
7-day averageFirst hurdle on any bounce~$1.32
30- and 50-day averagesWhere recent rallies stalled$1.41–$1.44
Late-September highsSources differ slightly$1.57–$1.66
Where 2026 beganA close above shows real demand$1.84
What Happens Next
Two dates are worth marking. On 23 October an XRP Ledger bug-fix amendment could activate if validator support holds. It is plumbing rather than a price event, and the more talked-about lending feature is still short of the votes it needs, so it cannot ship alongside it. Then on 1 November the monthly escrow release lands. Neither is likely to decide the direction, but the escrow date will keep the supply argument in the headlines.
The better question is what would change the picture. Three things would:
Sustained ETF inflows. One good week is noise. Several weeks of steady net buying would show demand arriving.
$1.25 holding on a retest. A higher low above the September level would be the first technical sign that sellers are tiring.
A close above $1.84. That would wipe out the year’s losses and say demand is real.
The reverse is just as clear. If $1.25 breaks on a daily close, the next stop is the August low near $1.00, and a break below that would be the most serious damage XRP has taken in nearly two years. If broader crypto weakens, XRP has shown it falls with it, and sentiment has leaned that way. Over the last two months, crypto has been one of the weaker sectors, and you can track how it compares with equities and commodities on our Sector Rotation Tracker.
The bottom line
XRP is weak for reasons that are slow to fix: a large and growing supply, thin demand and a token that does not capture the success of the company behind it. None of those is a crisis, and none will disappear next week. Whether XRP has found its bottom depends on a simple test. If $1.25 holds and ETF buying keeps building, this looks like a base. If $1.25 breaks, the August low is the next place to look. Watch the levels, not the headlines.


Comments
Log in or sign up to join the conversation.