
.jpg")
Nvidia (NVDA) is the largest company in the world, which also makes it the largest semiconductor company. Therefore, you would think that what’s good for the stock is good for the Philadelphia Semiconductor Index (SOX) and vice versa. Most of the time, that's the case, but over the last month, we’ve seen the opposite play out, prompting the question above.
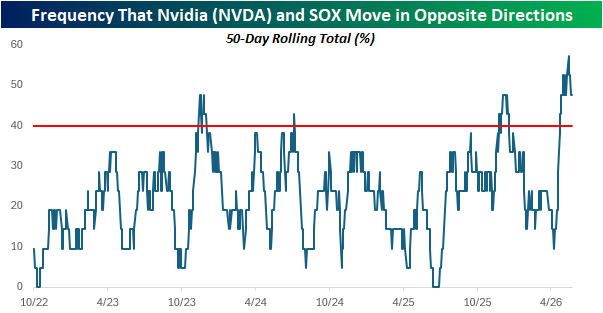
Over the last 21 trading days, the daily moves of NVDA and the SOX have been in opposite directions ten times (48%). Just last week, the divergence was even wider, with the two moving conversely on 12 of 21 trading days (57%).
Since this bull market started in October 2022, the two have never moved in opposite directions more frequently than they have in recent weeks. The only other periods where daily divergences occurred with nearly as much frequency were in December 2023, July 2024, and December 2025.
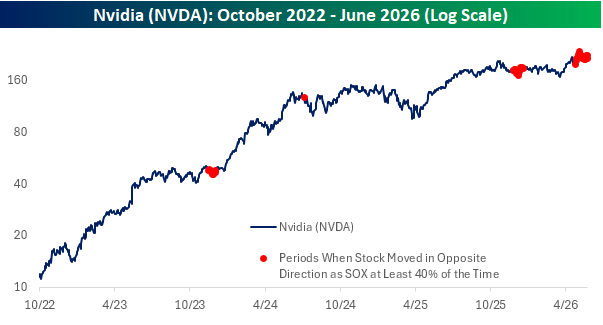
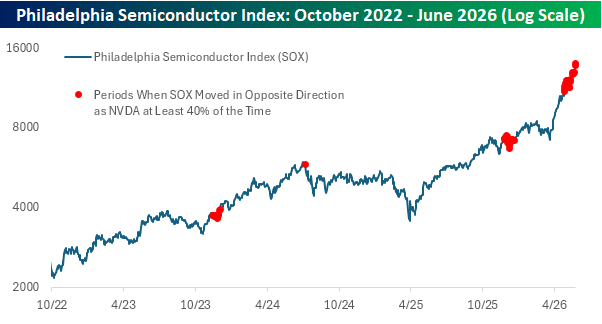
We were curious to see if prior periods of such high-frequency divergence signaled a trend moving forward. In the charts below, we show the performance of NVDA and the SOX since the start of the bull market, with red dots highlighting every time the 21-day frequency of daily divergences exceeded 40%.
For both NVDA and the SOX, forward returns following these periods were all over the map, featuring gains, losses, and sideways trading alike. Therefore, as tempting as it may be to read the recent divergence as a canary in the coal mine for NVDA or the semiconductor space, it’s probably nothing more than a short-term quirk.

Comments
Log in or sign up to join the conversation.