
BOJ COMES TO THE RESCUE
This week reminded me of the recent AFC Championship game as the Denver Broncos defeated the New England Patriots in the final seconds of the game by foiling the 2-point conversion attempt. The market, like the Patriots, struggled all week with any ground gained one day, lost the next.
Fortunately, for investors, instead of the final play of the game being an interception sending the Patriots into defeat, it was the BOJ completing the conversion and sending the “Bulls” on a rampage on Friday.
However, the announcement by the Bank of Japan (BOJ) to implement negative interest rates in a desperate last attempt to boost economic growth in Japan was only the catalyst that ignited the bulls. The “fuel” for the buying came from the end of the month portfolio buying by fund managers. As I wrote Thursday evening:
“But where could that lift come from? The first is month-end window dressing by fund managers after a brutal start to the new year. After much liquidation, fund managers will need to rebalance holdings.
The second is the potential for Central Banks to intervene which could embolden the bulls as further support could temporarily delay the onset of a bear market and recession. Note: I said temporarily. Pulling forward future consumption is not a long-term solution to organic economic growth.
Not to be disappointed, the BOJ announced a move into NEGATIVE interest rate territory to try and boost economic growth in Japan. (Interestingly, however, was the lack of increase in QE.) The announcement was a shock to the markets as the BOJ had just stated last week that negative interest rates were not being considered.”
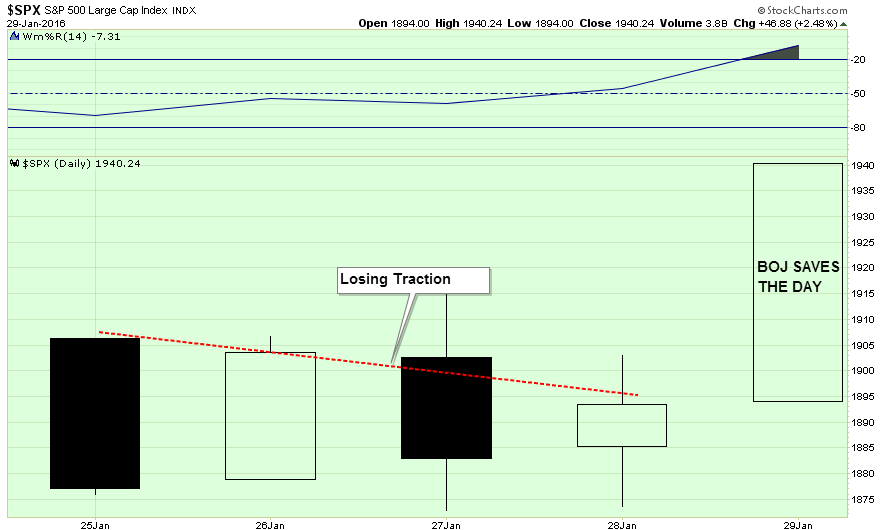
Importantly, the rally pushed the major averages out of the consolidation pattern that had me worrying on Wednesday about the possibility of a technical breakdown. To wit:
“Over the last few weeks, I have suggested the markets would likely provide a reflexive rally to allow investors to reduce equity risk in portfolios. This was due to the oversold condition that previously existed which would provide the “fuel” for a reflexive rally to sell into.
I traced out the potential for such a reflexive rally two weeks ago as shown in the chart below.”
(Chart updated through Friday’s close)
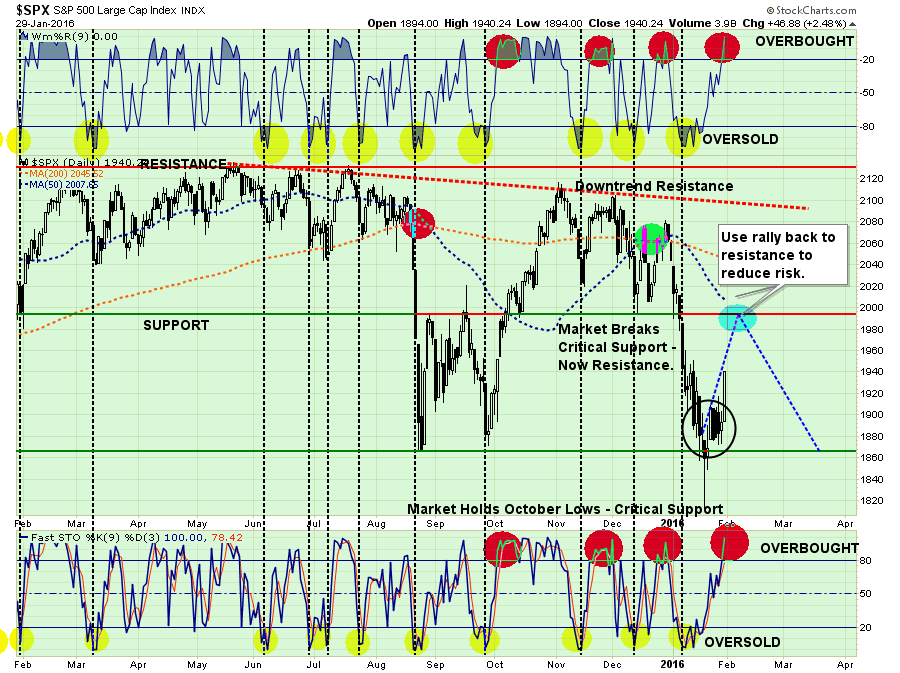
The most important parts of the chart above are the overbought / oversold indicators at the top and bottom. The oversold condition that once existed has been completely exhausted due to the gyrations in the markets over the last couple of weeks. This leaves little ability for a significant rally from this point which makes a push above overhead resistance unlikely.
“Just as an oversold condition provides the necessary “fuel” for an advance, the opposite is also true.”
SO, HERE IS THE QUESTION
Have the “bulls” have regained control of the markets OR is this THE RALLY we have been looking for to reduce portfolio risk into?
I can honestly say I do not absolutely KNOW for certain, but the internals of the market still suggests a “bear market” remains intact currently. This is an important point. All bull markets end as well as bear markets. The important thing to know are the rules that apply to each.
- In bull markets – buy dips
- In bear markets – sell rallies.
The chart below shows the distinct price trend channels of both bull and bear markets.
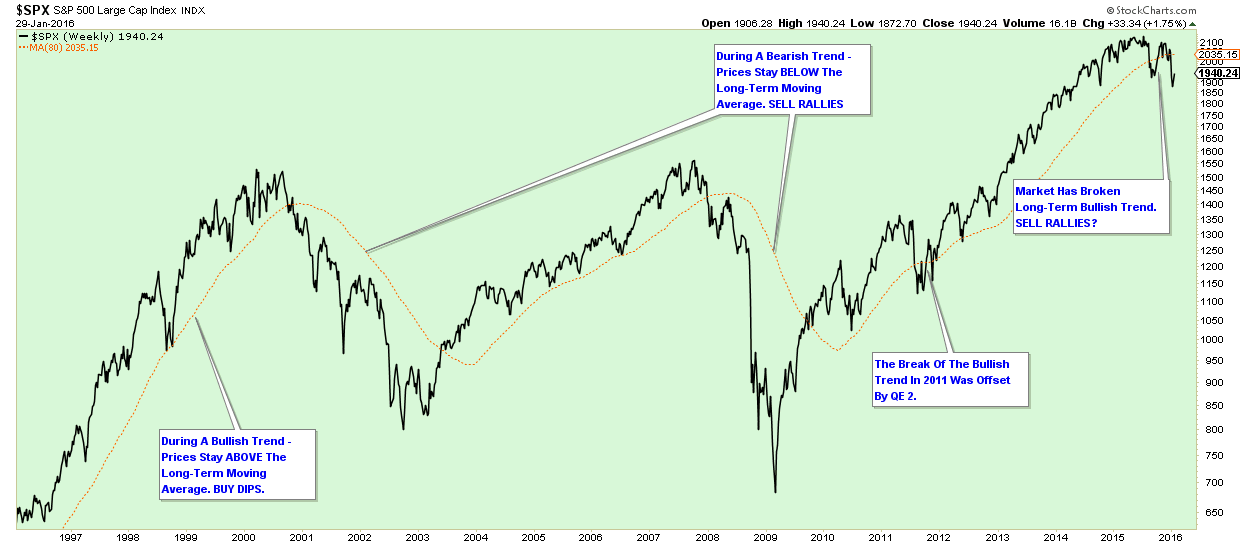
During bull markets, prices remain in a steadily rising price trend. This keeps prices trading above a RISING long-term moving average as shown in the chart above. During a bear market, prices remain in a steadily falling price trend. This keeps prices trading below a DECLINING long-term moving average.
During a rising price trend, “buying dips” is a profitable process. However, during a falling price trend, “buying dips” is hazardous to your financial health.
While being “bullish” is always much more “fun,” it does you little good to be “bullish” during a negative price trend in the market. Currently, the market has once again broken its long-term bullish price trend. Without the Federal Reserve intervening, as they did in 2011, there is little reason currently to expect the market to regain its bullish footing in the near-term. Until the price trend changes, this market is exhibiting all the traits of a decline price trend.Therefore, we sell rallies until the price trend changes.
This idea of a declining price trend was also a point made by Michael Kahn via Barron’s last week:
“While the S&P closed below the critical 1867 level outlined here last week, it did not stay there. It was a false breakdown as the index moved higher the next day.
That got bullish juices flowing. After all, a reversal pattern, failed breakdown with heavy volume at a key support level combined for a potential bullish turn (see Chart 1).”
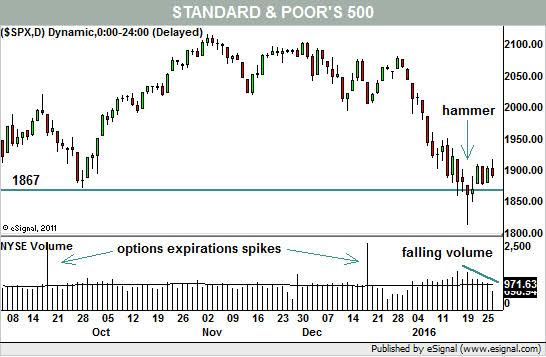
“Unfortunately, over the next few days the stock market saw nothing but volatility and very little net progress, at least in the context of what usually happens when the market forms a “V” bottom. Named for the market’s quick fall and equally quick rebound, it is supposed to be a sharp turnaround. Look back at the sharp rebound in October 2014 following the Ebola panic as a great example of the “V.”
But volume since the reversal day presents a problem as it has been falling on both the New York Stock Exchange and on the Nasdaq ever since. That is more of a marker for a bounce in a falling trend than evidence of a change in market mood. If this were truly a bottom then we should see more volume, not less, as bottom-fishing turns into true buying power.“
Absolutely.
INTERNALS STILL SUGGEST CAUTION
However, let’s step away from price trend analysis for a minute and look at some of the internal measures of the market for more clues.
If the S&P 500 is the “body” of the market, we can look at things that make up the “health” of the market for signs of illness. In much the same way that your body aches and you get “the sniffles” before the onset of a cold, the markets begin to exhibit similar symptoms warning on an impending decline.
Let’s take a look at a few of the more important ones.
The first chart below is the number of stocks hitting new highs versus new lows on the New York Stock Exchange.
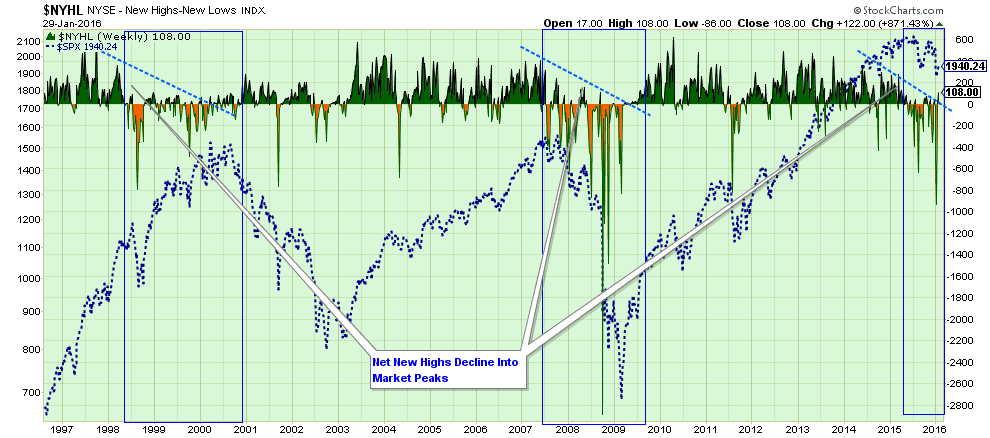
The blue boxes show a similar pattern during bear market declines where more stocks continue to trade at new lows than new highs. Something we are currently witnessing.
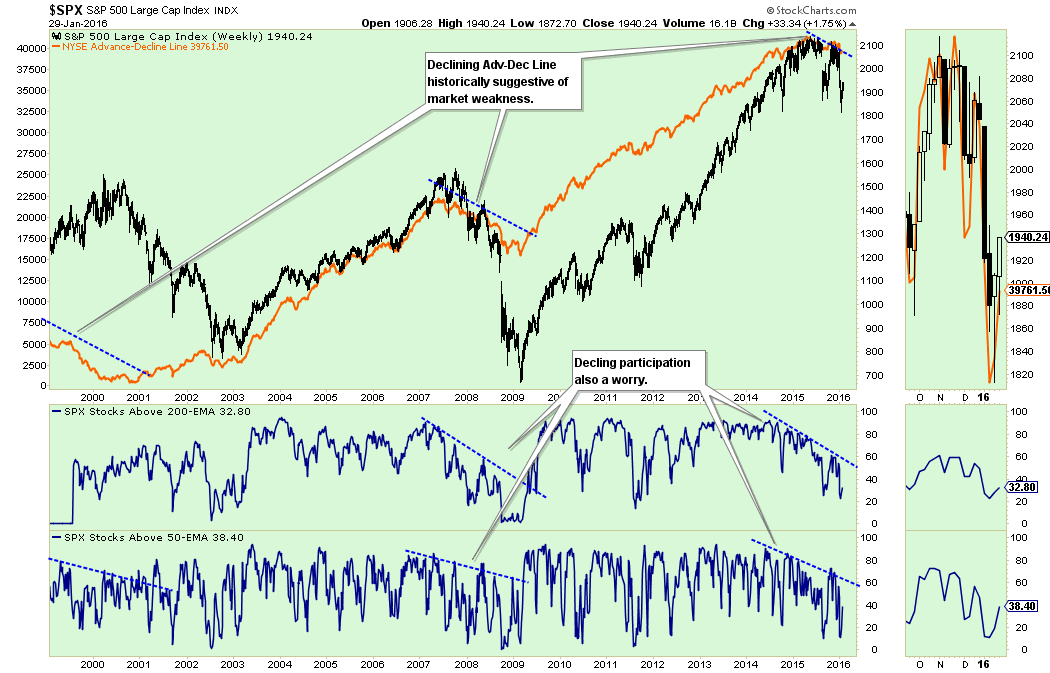
Another way to look at the health of the market is the number of stocks that are currently advancing in price versus those declining. Once again, we see a similar pattern emerging where the declining ratio of advancing stocks signals a more bearish trend in the market.
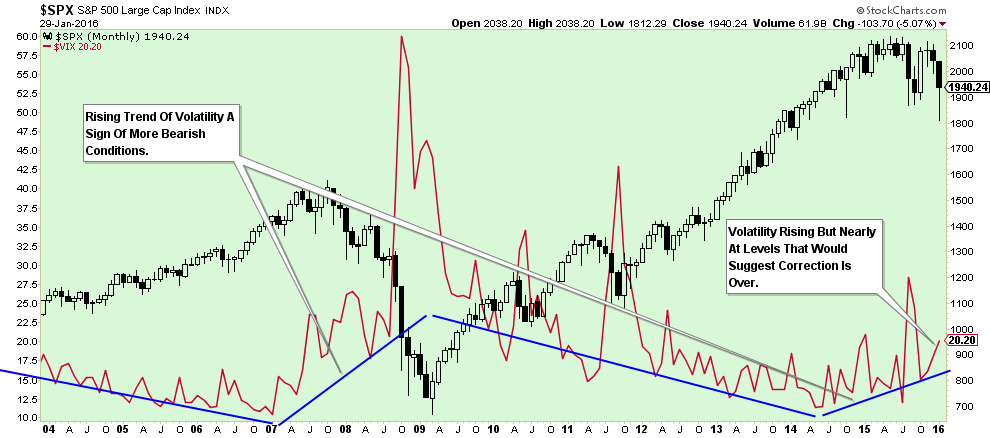
Volatility has also been trending higher. As shown in the chart below, while volatility has been on the rise, a trend last seen just prior to the last major correction, current levels of volatility suggest that the markets have not reached a level of “panic” that would denote the end of a bear market.
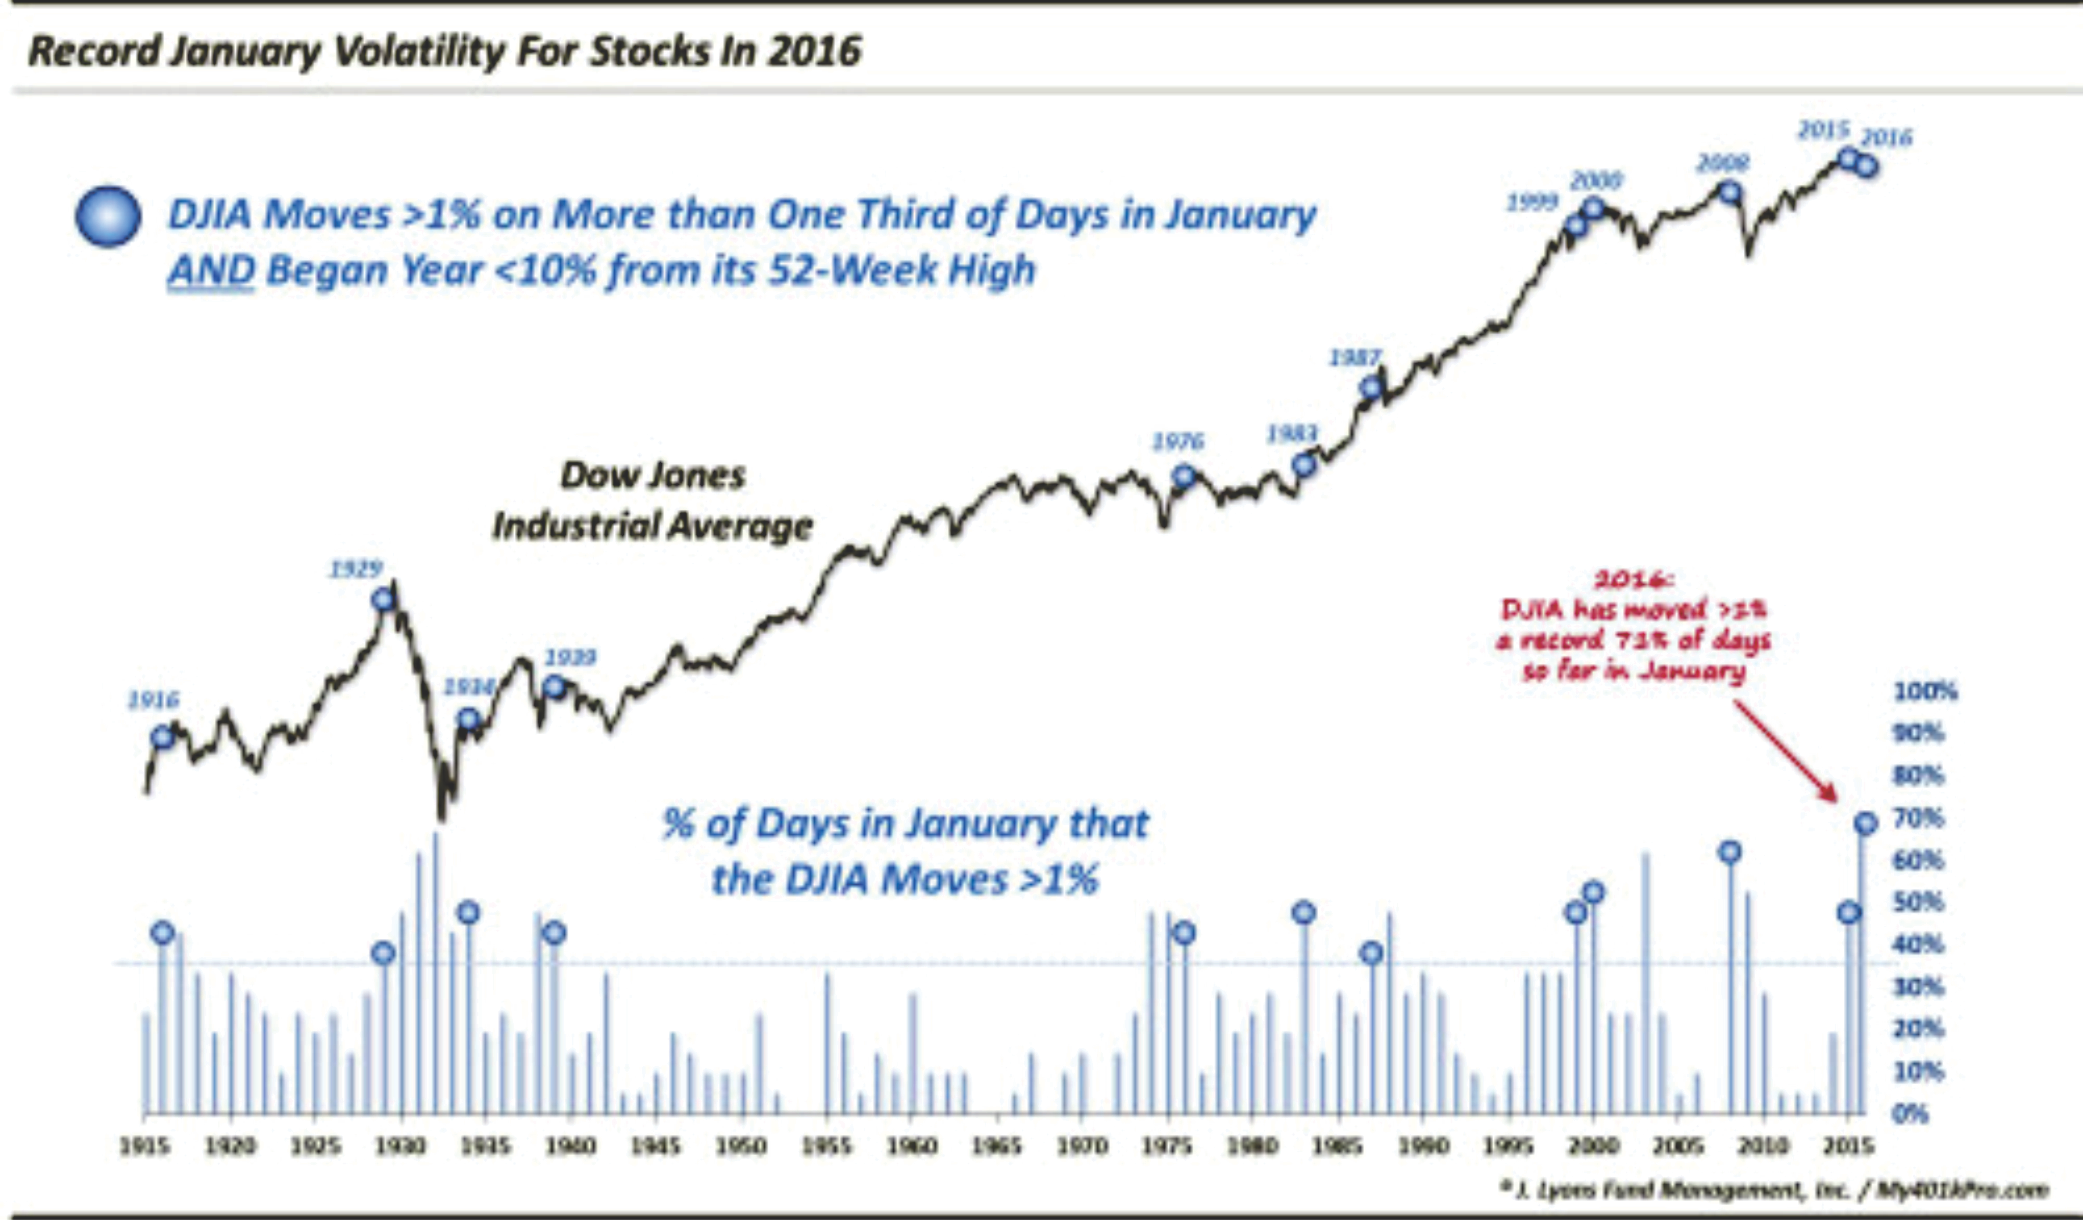
Dana Lyons also made a very interesting observation about January volatility spikes last week:
“First of all, 9 of the 11 occurred within the confines of a secular bear market (FYI, our view is that the market is still likely in the post-2000 secular bear so we are including 2015 in that category). Only 1983 and 1987 took place in a secular bull. And while the market fared just fine in the years following those two, 1987 did bring a little surprise later in the year. All in all, however, these volatile January’s that occurred relatively close to the DJIA’s highs did not lead to very attractive returns over the long-term.”
Furthermore, and this is a point that has been hit on frequently as of late by the media, is the collapse of the high-yield market. It is currently being dismissed as being all energy-related, however, in the past it hasn’t really mattered. Once the “fear of contagion” begins, the subsequent rout will be devastating.
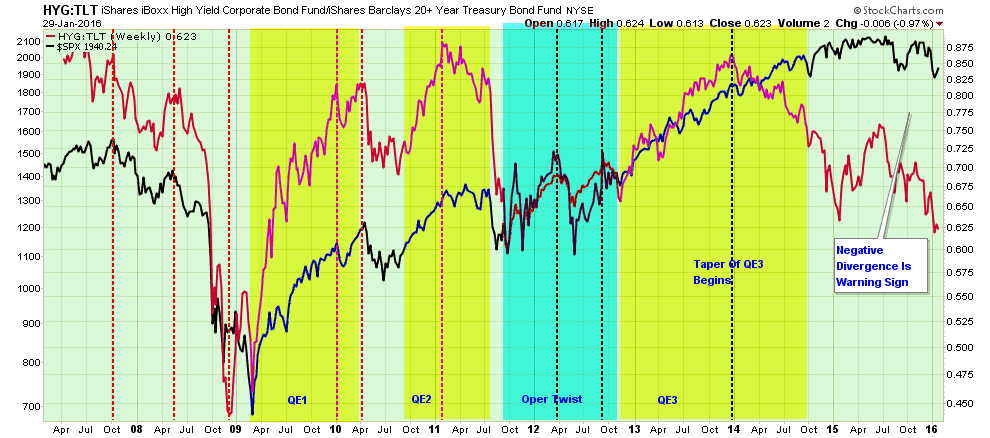
Importantly, the collapse in the high yield market also affects two of the major underpinnings of the markets rise over the last couple of years in particular: debt-funded stock buybacks and M&A.
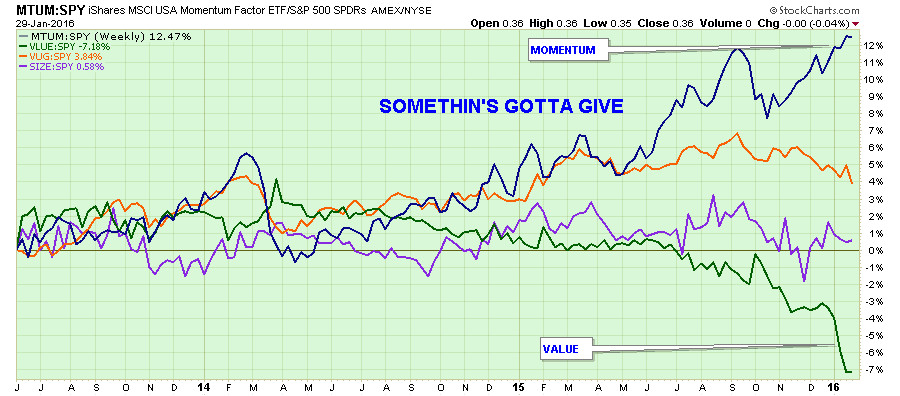
Lastly, in late stages of bull markets, the chase of “Momentum” stocks continues to build. As the number of stocks rising narrows, know as breadth, the ultimate reversion has been historically rather nasty. Currently, we are seeing a rather fantastic deviation between Momentum and Value stocks. Something will eventually give.
STILL A “SELL THE RALLY” MARKET
As I laid out last week, the markets were oversold enough on a short-term basis to have a fairly healthy reflexive rally. With the internals of the market still weak, along with the economic and fundamental backdrop still deteriorating, there is little reason to believe the market has completed its corrective process.
As shown in the chart below, the levels identified last week remain good targets for taking some risk management actions in your portfolio.
1970ish – Sell laggards and losers in portfolios. Take profits in winners and raise some cash as a hedge against further volatility. (I would do the bulk of your risk management in this zone as I don’t currently expect the market to be able to achieve the next two levels.)
2000ish – Continue rebalancing portfolios to reduce risk. Take profits and sell losers.
2030ish – Be at final risk-adjusted allocations.”

IMPORTANTLY: Notice the market has now traced out a fairly definitive “head and shoulder” technical pattern similar to that seen in 2008. If this rally fails, and breaks neckline support at recent lows, the market will be in a confirmed bear market.
WE ARE NOT IN A BEAR MARKET…YET
I want to close with this.
“We Are NOT In A Bear Market…Yet.”
However, as an investor, if you wait for confirmation of an official bear market, more than half of the damage to your portfolio will already be done. (Confirmed bear is when the market is down 20%, the average historical bear market / recession is down 33%)
What you decide to do is up to you, however, if you look at your portfolio and see holdings down 20, 30, 40 or 50%, shouldn’t you ask yourself why? The math of making up those losses will take an exceptionally long amount of time which means you have capital that is no longer working to further your financial interest. Making up losses has never been a strategy for building wealth. This is likely a good time to reassess how you, or your advisor, is managing your money.
No, we are not in a bear market yet. However, there are more than enough signs that suggest one may be stalking us.
Besides, the last guy I saw get mauled by a bear didn’t look so good afterward.

(Leonardo DiCaprio in the Revenant)
Have a great week.

Comments
Log in or sign up to join the conversation.