

Investors are currently struggling through some nerve-wracking weeks. In the stock market, everyone is watching AI companies with bated breath, wondering whether the much-discussed “bubble” will burst soon or keep going for a few more rounds. Gold investors, on the other hand, are fixated on the psychologically important $4,000 mark and are asking the legitimate question of when this correction, which has been ongoing since January, will finally come to an end.
We’re therefore showing the key chart from last week’s analysis once again. While the 4,000 mark may exert a certain psychological pull, what’s truly decisive is the cluster of support levels around $3,965 and slightly below. On the positive side, this zone has been confirmed several times so far—though, of course, that doesn’t mean it’s now set in stone. At the same time, we can see the green, downward-sloping downtrend line. Should the gold price break above it, the correction will likely have reached its final chapter. It’s also interesting to note that this green line—currently at $4,280 per ounce of gold—will already reach the current level by the end of July. A major decision is therefore likely to be made before the end of this month.
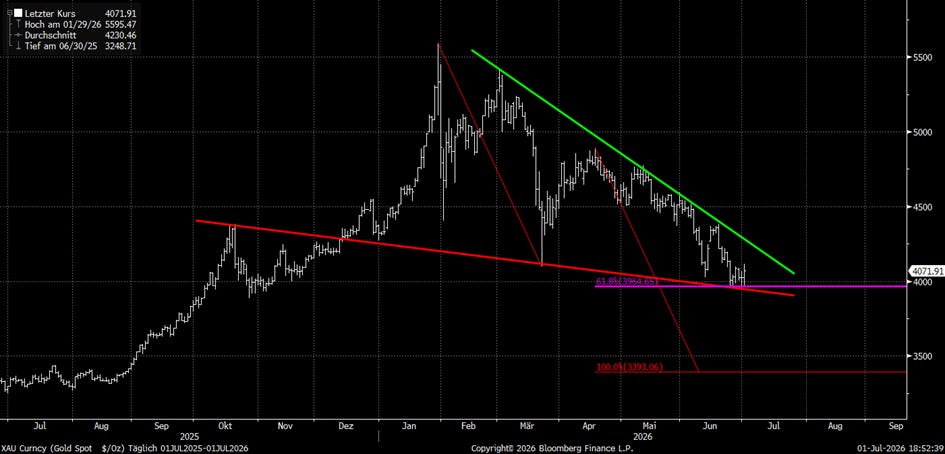
Today, the new Fed Chair Harsh did have a small silver lining in store for gold bugs, but the U.S. jobs report coming out this Friday could trigger fresh selling pressure if the economic data comes in very strong.
This really leaves only one strategy: If support gives way contrary to expectations, we’re likely to see another sharp sell-off. That would be less of a doomsday scenario and more of a great opportunity to buy at even lower prices.
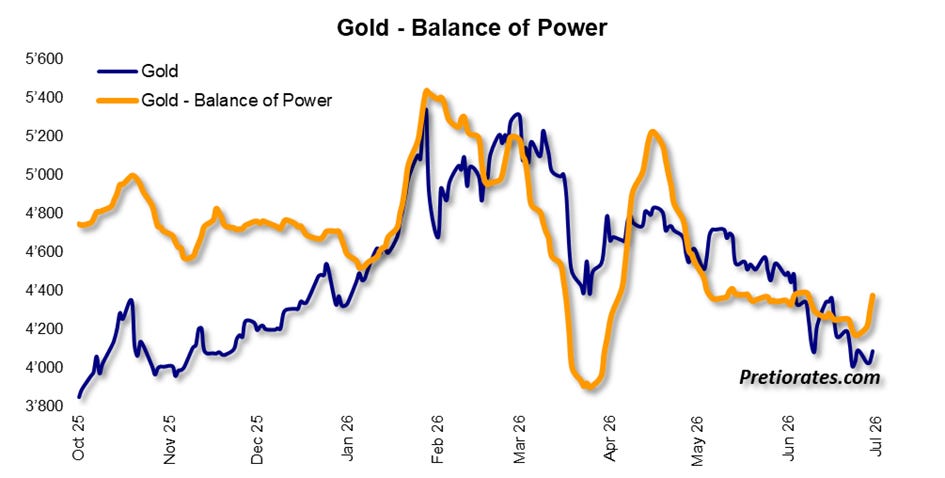
Hopes for a successful defense are rising, as the Balance of Power has shown an upward trend over the past few days for the first time since mid-April. This indicator does not show the trend of the asset itself, but rather the balance of power between the two camps: bulls and bears. If the indicator points upward, the bulls have the advantage. In soccer terms, they would be the team in possession of the ball—hopefully with more conviction than many of the major soccer nations at the current World Cup.
Sentiment in Western gold trading is also showing positive signs: the pessimistic mood is steadily brightening.
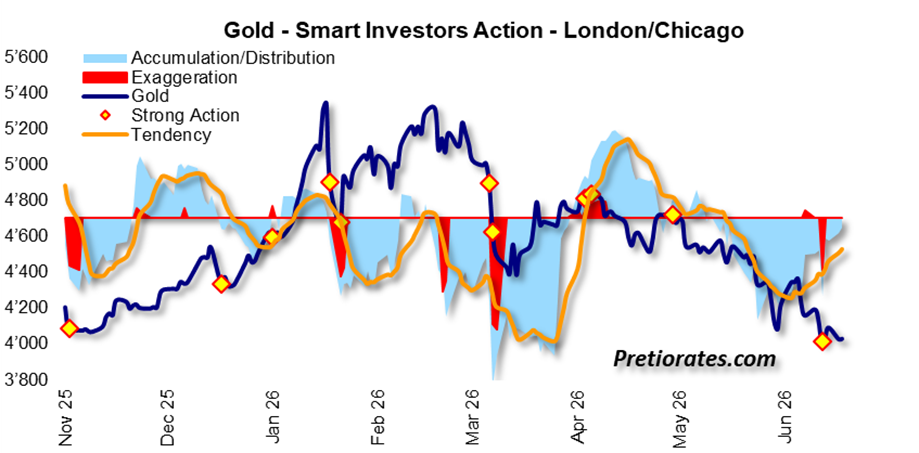
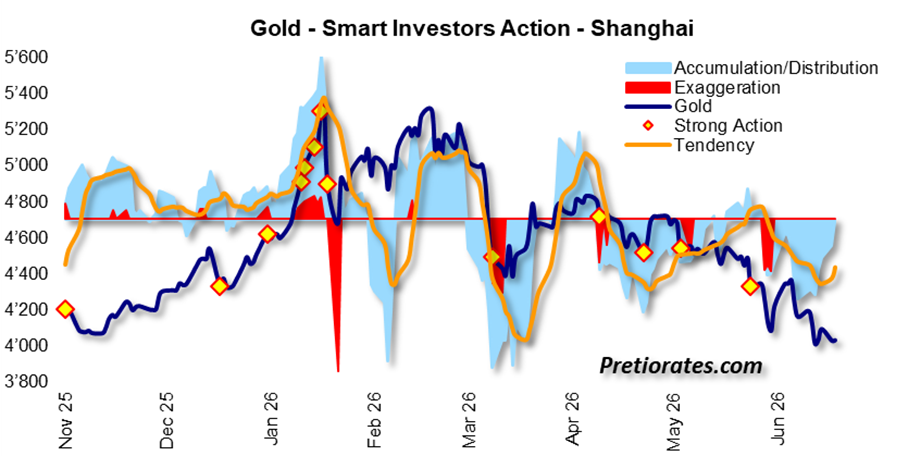
In China, too, many investors have been caught off guard in recent months. It is therefore all the more encouraging that the cautious mood is gradually coming to an end in Asian trading as well.
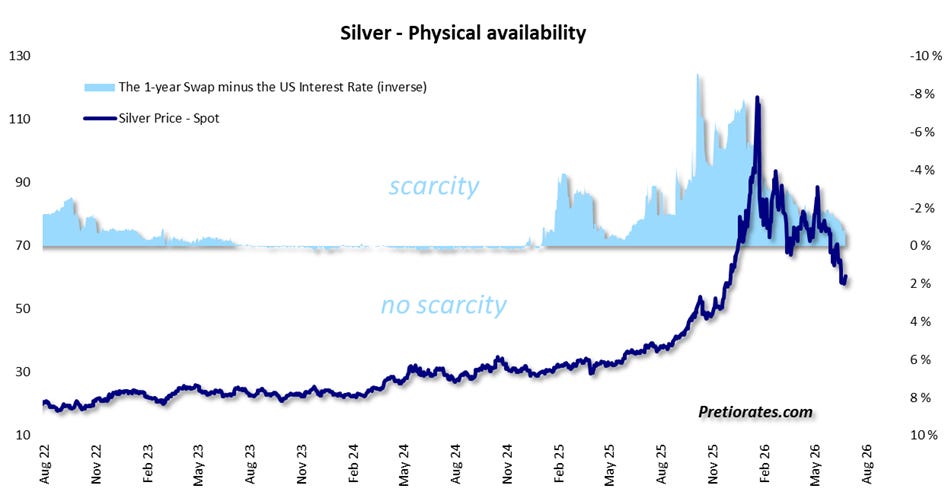
The fact that Chinese investors—who are particularly interested in physical metal—were recently caught off guard is also reflected in measurements of silver’s physical availability. The shortage has continued to ease recently, likely because some investors had to sell. This may be a disappointment for those hoping for another parabolic price rally. However, a renewed price rise is by no means off the table.
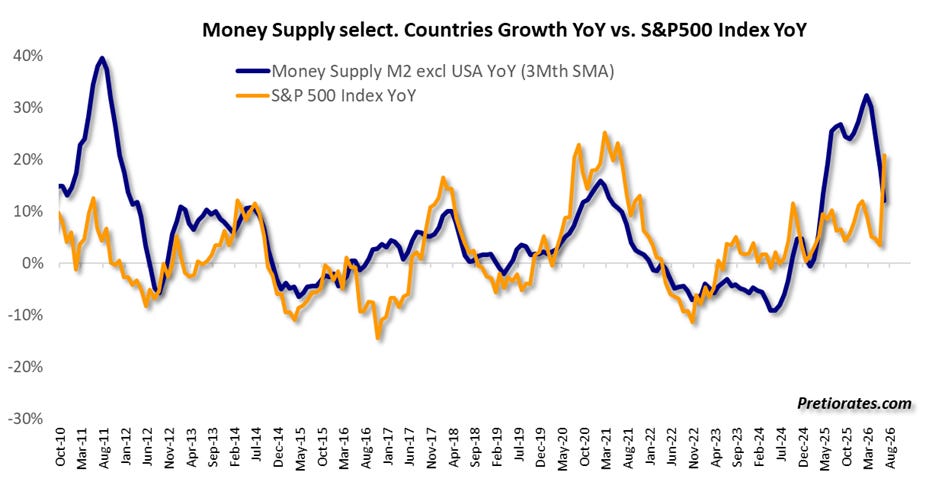
A look at the overall market. As mentioned several times in previous posts: The most important driver of a rising stock market is liquidity. And this is determined not least by the central banks, particularly the Fed. It is therefore hardly surprising that there is a high correlation between the percentage change over the past twelve months in the M2 money supply and the S&P 500 Index. But we must note: While the U.S. stock index still shows an increased percentage change over a twelve-month period, that of M2 has long been falling—and not exactly at a homeopathic pace. So the stock market is still dancing, even though it’s increasingly running out of steam…
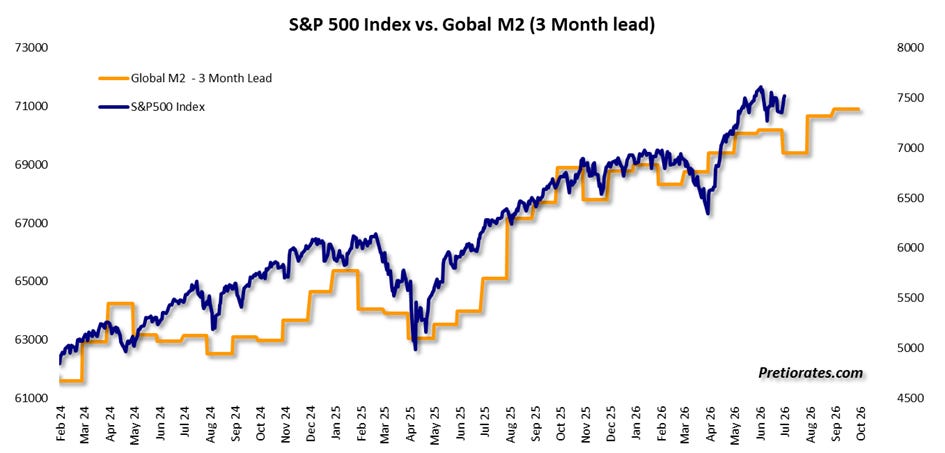
It explains why the stock market has shown such fear of higher interest rates in recent months: Higher interest rates curb lending, thereby slowing the generally steady growth of M2. And when liquidity flows less freely, the hangover after the party sets in much faster.
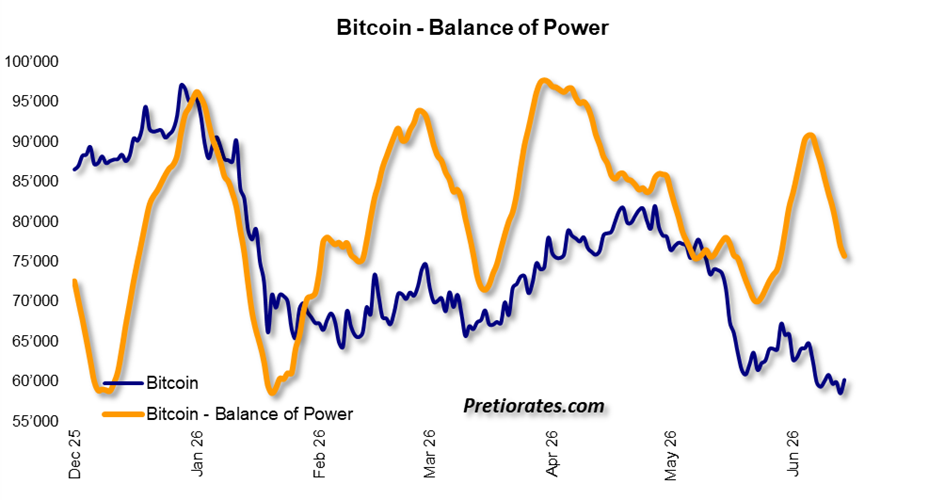
In previous posts, we’ve also toyed with the theory that the performance of cryptocurrencies is heavily dependent on liquidity. The more liquidity is available, the more money investors have at their disposal for investments outside of traditional assets. Accordingly, it comes as little surprise that the crypto markets have recently performed rather weakly. When the liquidity tap is turned off, the speculative players are usually the first to tone down their exuberance. The fact is: the balance of power shows that the bears are still in control of Bitcoin, and the correction is likely not over yet…
Bottom Line: Precious metals are facing their ultimate test over the next few weeks. However, sell-offs should present buying opportunities. The stock markets are also likely to face their own tests—only they’ll be entering the fray with significantly less breathing room…



Comments
Log in or sign up to join the conversation.