

The latest figures published by the U.S. Treasury confirm a further deterioration in the country's public finances, with a federal deficit of $1.992 trillion for fiscal year 2026 ending on September 30, compared with $1.775 trillion the previous year:
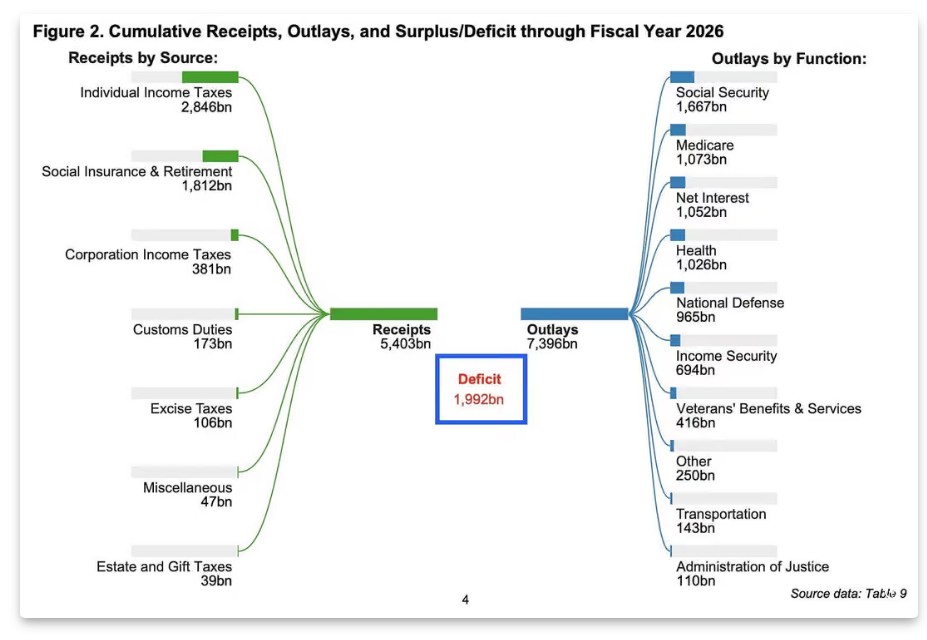
This deterioration comes despite rising tax revenues, which increased by 3.2% to $5.403 trillion. Yet that growth was insufficient to offset a 5.5% increase in federal spending, to $7.396 trillion. In other words, despite historically high tax receipts, Washington continues to spend nearly $137 for every $100 it collects, borrowing the difference on the bond markets.
This deficit, now equivalent to approximately 6.2% of U.S. GDP, would be considered substantial during any recession. It is considerably more troubling in an economy that has not yet experienced a genuine contraction in activity. The United States continues to run deficits normally associated with periods of crisis, even as unemployment remains relatively contained and tax revenues still benefit from economic activity and elevated valuations of financial assets. The challenge lies therefore no longer simply in the size of federal debt, but in the question whether the U.S. government will be able to stabilize its fiscal trajectory without triggering a sharp economic downturn.
The composition of federal spending helps explain why this situation is becoming increasingly difficult to control. Social Security benefits now account for $1.667 trillion, Medicare for $1.073 trillion, other healthcare spending for $1.026 trillion, and national defense for $965 billion. Yet the figure demanding the closest scrutiny is net interest on the federal debt, which has surged to $1.052 trillion – surpassing military spending and consuming nearly 20% of federal revenues.
This threshold matters because interest is an expense over which Washington has very little short-term control. Unlike discretionary spending, which can theoretically be cut or deferred, debt-servicing costs are dictated by the outstanding stock of federal securities, their refinancing schedules, and the yields investors demand. Every bond reaching maturity must be repaid or refinanced. When rates remain elevated for a prolonged period, older securities, often issued on far more favorable terms, are gradually replaced with more expensive debt.
The problem is self-reinforcing. Larger deficits increase borrowing needs, potentially putting upward pressure on bond yields; higher yields, in turn, raise financing costs and interest expenses, further widening the deficit. The scale of this dynamic is significant: a one-percentage-point increase in the average financing cost of a $30 trillion debt stock would add $300 billion to annual interest expenses once fully reflected across the debt.
Customs revenues – the much-discussed tariffs – often presented as a major source of additional funding, do not fundamentally change this equation. At $173 billion for the fiscal year, they amount to just 8.7% of the annual federal deficit, illustrating the scale of the imbalance that needs to be corrected. Even assuming these revenues continue to rise, they would remain far too small to offset spending dynamics dominated by social programs, healthcare and, increasingly, debt servicing.
The U.S. bond market must therefore absorb an enormous supply of Treasury securities, not only to finance new deficits but also to refinance existing borrowings, in an environment where investors may demand greater compensation for duration risk and future inflation. It is against this already fragile fiscal backdrop that a second source of pressure emerges: oil.
Oil further complicates the bond market equation
Tensions in the oil market could hardly come at a worse time for U.S. public finances. Rising energy prices risk keeping inflation expectations elevated just as slowing activity in several sectors would normally favor an easing of monetary conditions. Brent crude closed the October 20 session at around $109 per barrel, after exceeding $111 intraday, while WTI traded near $98 – levels that are beginning to weigh on transportation costs, household spending and the margins of many businesses.
Diesel and marine fuel prices remain particularly high, reflecting persistent tightness in refined-product markets despite fluctuations in crude oil prices. This is even more concerning because the vast majority of global seaborne trade still relies on vessels powered by petroleum-based fuels, primarily marine fuel oil and distillate fuels.
Since the start of the war in the Middle East, ocean freight costs have already doubled on some major trade routes, driven by the combined effects of higher fuel prices, insurance premiums and disruptions to established shipping routes. These rising transportation costs are beginning to ripple through global supply chains, intensifying inflationary pressures as higher import costs gradually translate into higher prices for businesses and consumers.
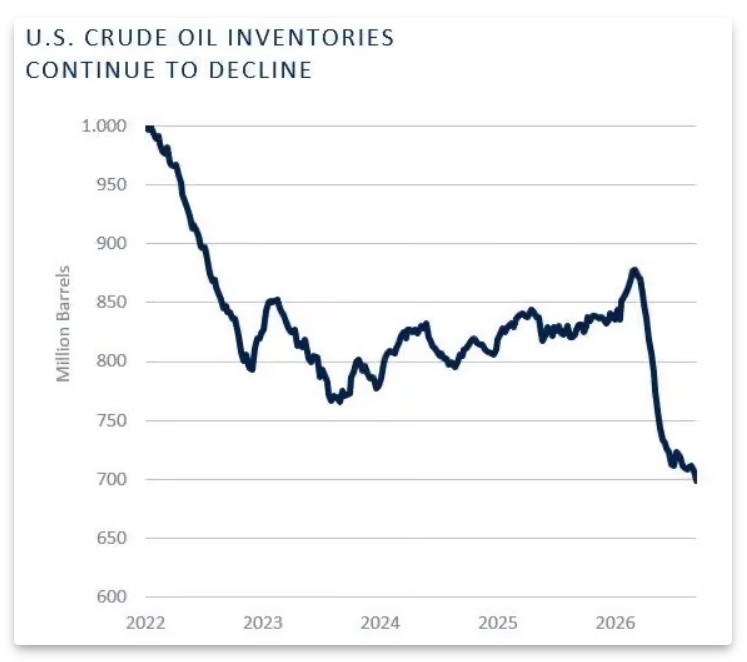
The latest indications from U.S. oil inventories point in the same direction. Preliminary American Petroleum Institute data suggest a 4.9-million-barrel decline in crude stocks, accompanied by decreases in gasoline and distillate inventories. These figures still need to be checked against official statistics, but at this stage they do not suggest a physical market characterized by an obvious abundance of available supplies.
The resumption of Chinese buying after the Golden Week holiday is another factor worth watching. Several observers report particularly strong buying activity during Asian trading sessions, before European and U.S. markets open, which could help support crude prices despite periods of weakness during Western trading hours. However, it remains to be seen whether these movements reflect additional physical purchases, hedging activity or purely financial transactions, since that distinction is essential to assessing their lasting effect on market balances.
The macroeconomic risk is clear: if oil-market tensions persist and energy prices remain elevated, inflation could prove more stubborn than expected, even as signs of weakness emerge across several sectors of the U.S. economy. This would leave the Federal Reserve caught between persistent price pressures and a slowing economy. Meanwhile, bond investors may continue to demand a substantial term premium to hold long-dated securities, constraining the scope for long-term interest rates to fall.
Long-term interest rates transmit the shock to the housing market
The effects are becoming particularly pronounced in the U.S. housing market, where rising borrowing costs have steadily eroded household purchasing power and dampened transaction activity.
Yields on 10-year U.S. Treasury bonds recently exceeded 5.3%, while 30-year yields rose above 5.6%, before easing slightly. These levels matter because U.S. 30-year mortgage rates are driven largely by long-term bond yields, plus the risk premiums investors demand on mortgage-backed securities, hedging costs, and lenders’ margins.
The average rate on a 30-year fixed-rate mortgage was therefore around 7.5% in mid-October, a level that radically changes the financial terms of buying a home compared with those available to households just a few years ago.
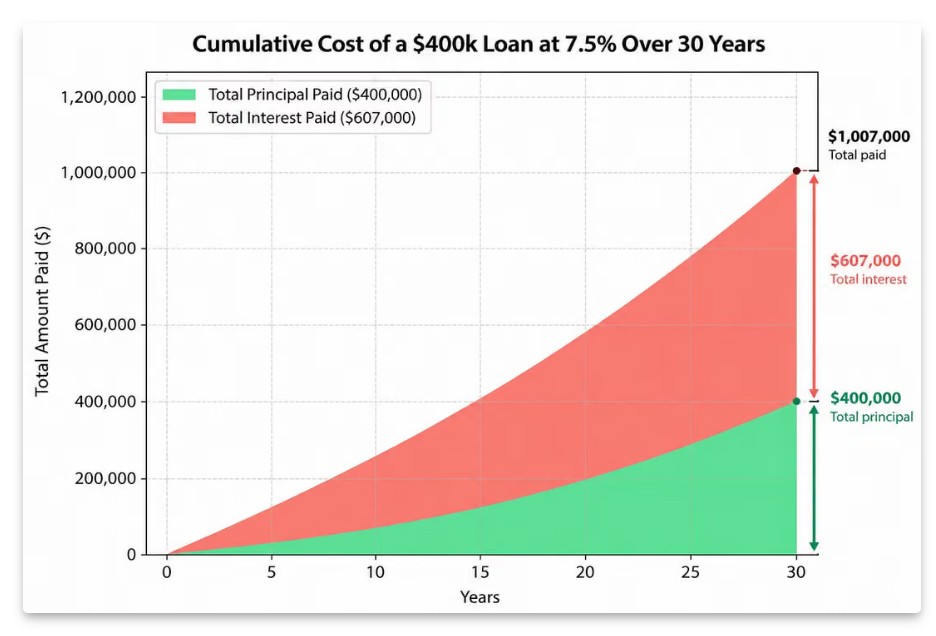
To appreciate the scale of the change, the chart above illustrates the cost of a $400,000 mortgage over 30 years at the current rate of 7.5%. At that rate, the monthly payment is nearly $2,797, and total repayments over the life of the loan exceed $1 million, including approximately $607,000 in interest – one and a half times the amount originally borrowed.
By comparison, the same mortgage taken out at 3% would have required a monthly payment of just $1,686 and approximately $207,000 in interest over 30 years. The rise in rates therefore adds nearly $400,000 to the total financing cost, even before accounting for insurance, property taxes and maintenance expenses.
The chart also shows that, during the early years, most monthly payments go toward interest rather than repaying principal, considerably slowing the accumulation of home equity for households.
Under these conditions, it is hardly surprising that the U.S. housing market is now virtually paralyzed. Higher borrowing costs have severely reduced household purchasing power, while home prices have not undergone a comparable adjustment.
But the problem runs deeper, because higher interest rates do not only penalize first-time or prospective buyers. They also lock in a large proportion of existing homeowners, who secured mortgages at historically low rates and have no financial incentive to sell their homes and buy another, giving up financing at 2.5% or 3% in exchange for a new mortgage at 7.5%.
This phenomenon, commonly known as the lock-in effect, reduces the supply of existing homes as well as residential and professional mobility among American households. The housing market thus faces a paradox: transactions collapse without prices necessarily falling by the same proportion, as potential sellers often prefer to keep their homes rather than accept a substantial reduction in their asking price.
A historic collapse in pending home sales
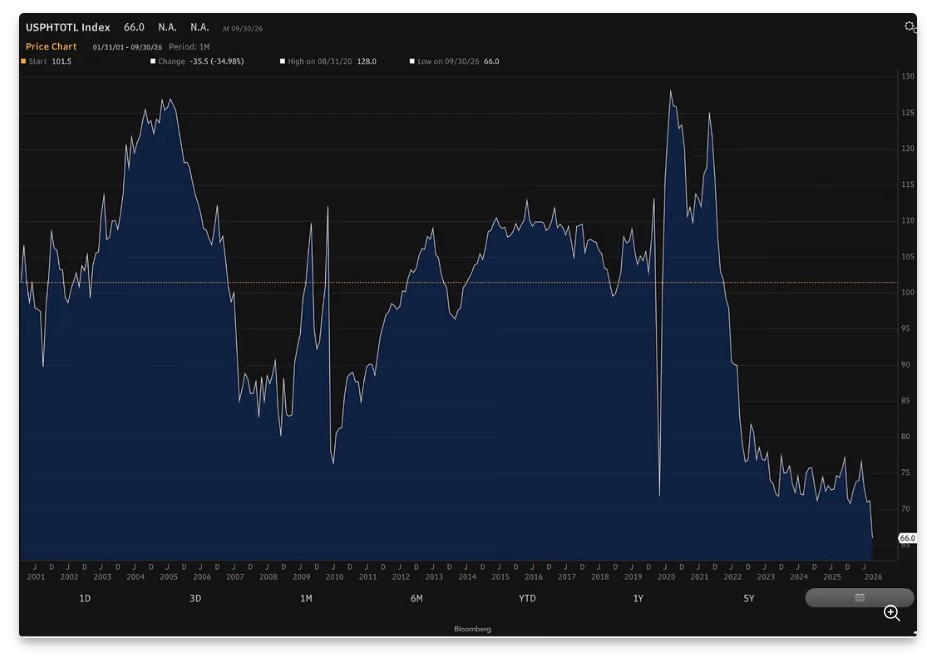
The Bloomberg chart accompanying this report perfectly illustrates the scale of the gridlock. The Pending Home Sales Index for existing homes fell to 66 in September 2026, its lowest level since the series began in 2001, following a 7.3% monthly decline and an 11.3% year-on-year contraction.
The historical comparison is particularly striking. The index reached 128 in August 2005, at the peak of the U.S. housing bubble, before collapsing during the 2008 financial crisis. It subsequently experienced several recoveries, notably after the pandemic, but the deterioration observed since 2022 has now pushed it below the level recorded at the height of the 2008–2009 housing crisis.
It is worth noting that this indicator measures signed sales contracts rather than completed transactions. That is precisely what makes it useful: it is a leading indicator of housing-market activity in the months ahead. Completed sales have not yet contracted to the same extent in the latest available month, but the collapse in pending sales suggests that transaction volumes will remain weak.
This situation is even more remarkable given that the U.S. population has grown since the early 2000s and the housing stock has expanded considerably. Even without adjusting for demographic changes, the index's current level points to exceptionally depressed transaction activity by the standards of the U.S. housing market's recent history.
The slowdown is also beginning to spread to residential construction. Single-family housing starts fell 4.6% in September to an annualized rate of 859,000 units, while corresponding building permits dropped to 845,000, their lowest level in roughly three and a half years. This decline matters because construction is a much broader economic engine than housing alone, stimulating demand for materials, equipment, transportation, financial services and labor.
The paralysis of the housing market therefore directly affects economic activity. It also reduces tax revenues linked to transactions, limits household mobility and can weigh on spending on durable goods, which typically accompanies moving and home purchases.
This is not necessarily a repeat of the 2008 crisis, since mortgage credit quality, financing structures and the condition of banks have improved. Nevertheless, the slowdown in transactions suggests that borrowing costs have reached levels that are increasingly prohibitive for a growing share of households, undermining the normal functioning of the housing market.
The risk of economic slowdown without meaningful interest rate relief
This is where the various pressures discussed in this report begin to converge. On one hand, the United States continues to accumulate federal deficits approaching $2 trillion a year, with interest expenses now exceeding $1 trillion and enormous refinancing requirements. On the other hand, tensions in the oil market sustain inflationary risks that complicate any decline in bond yields, even as the housing market shows signs of contraction rarely seen since the statistical series began.
The Federal Reserve faces a dilemma: a slowing economy would normally justify monetary easing, but a persistent energy shock could keep inflation expectations elevated, limiting its ability to ease financial conditions quickly. And even if the Fed decided to cut its policy rates, there is no guarantee that 10-year or 30-year Treasury yields would fall by the same amount, since they also depend on the inflation outlook, the term premium and the balance between supply and demand for government debt.
The risk, therefore, is that financing conditions remain restrictive for longer than the real economy can withstand, with consequences gradually spreading beyond housing to corporate credit, capital expenditure and equity valuations.
If bond yields remain high while housing activity continues to contract, markets may gradually be forced to reassess their assumptions about growth, profit margins and financing. Such a reassessment would be particularly difficult if it occurred just as credit spreads also began to widen, because a simultaneous rise in risk-free rates and credit premiums represents one of the most restrictive forms of tightening in financial conditions.
Gold faces twin threat of housing slump and stagflation
The risk now emerging for the U.S. economy is a particularly dangerous combination of a housing market paralyzed by high interest rates and inflationary pressures sustained by rising energy prices. On the one hand, more expensive credit is causing a historic collapse in housing transactions, weakening residential construction and increasingly threatening economic activity. On the other, persistent tensions in oil, diesel and transportation costs continue to fuel inflationary pressures, limiting the Federal Reserve's ability to ease monetary policy quickly.
It is precisely this combination of slowing growth and persistently high prices that is reviving the risk of stagflation in an economy already facing enormous budget deficits and an increasingly difficult-to-control interest burden.
In such an environment, gold once again demonstrates its relevance as a reserve asset independent of sovereign credit risk. Unlike real estate, whose valuation and liquidity are closely tied to financing conditions, or bonds, whose prices remain exposed to a further rise in yields, gold is not backed by any promise of repayment and requires no refinancing.
Faced with these twin risks – a collapse in housing-market activity and the possibility of entrenched stagflation – gold could reaffirm its role as a monetary safe haven, as confidence in traditional financial assets is once again put to the test.



Comments
Log in or sign up to join the conversation.