
As is well known, the recession talk has surged in the wake of the (short-lived) inversion in the 10yr-2yr spread.
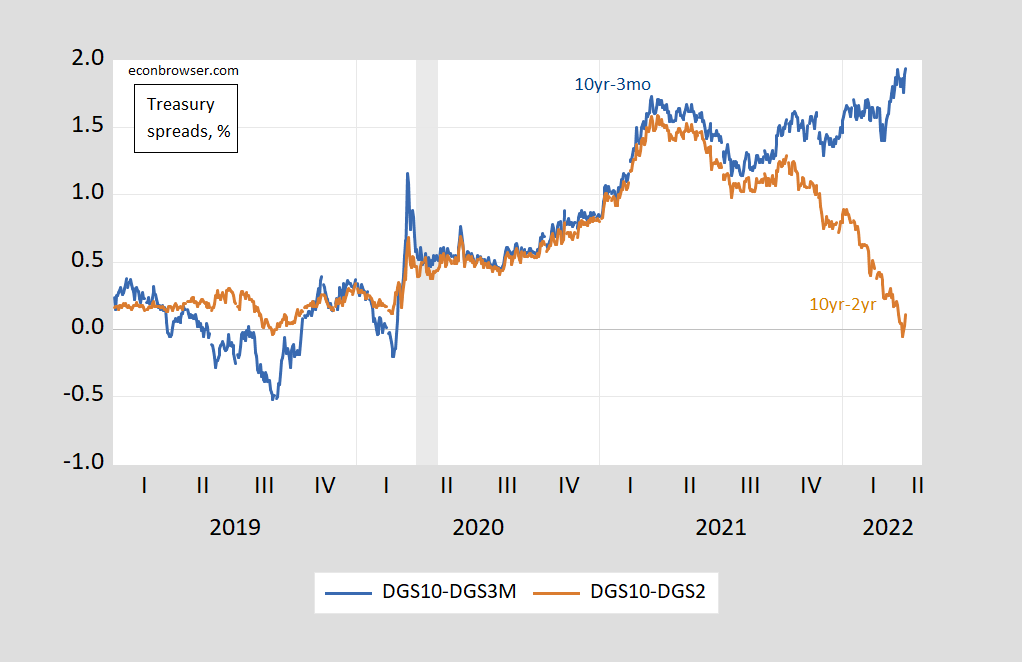
Figure 1: 10 year – 3 month Treasury spread (blue), 10 year – 2 year spread (brown), all in %. NBER defined recession dates shaded gray. Source: FRED, NBER, and author’s calculations.
What’s obvious is the wildly divergent signals coming the 10yr-3mo. In previous recessions, both spreads inverted.
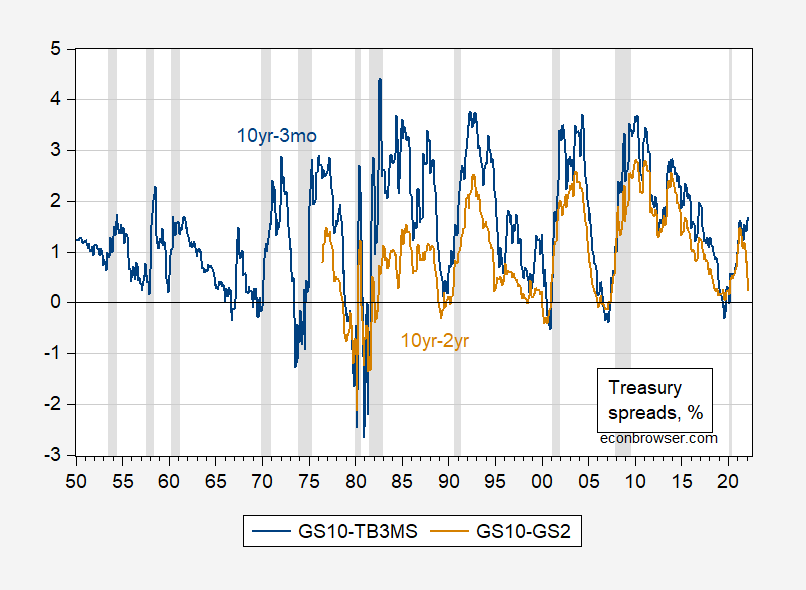
Figure 2: 10 year – 3 month Treasury spread (blue), 10 year – 2 year spread (brown), all in %. 3 month Treasury is on secondary market. NBER defined recession dates peak-to-trough shaded gray. Source: FRED, NBER, and author’s calculations.
The data in Figure 2 are monthly averages of daily data. At this frequency, one recession occurs with an inversion in 10yr-2yr, but not in 10yr-3mo. However, at the daily frequency, dual inversion always occurs before a recession (albeit only a few days).
Then, there is the related question: has an inversion in the 10yr-2yr ever occurred while at the same time the 10yr-3mo is spread is so large and positive?
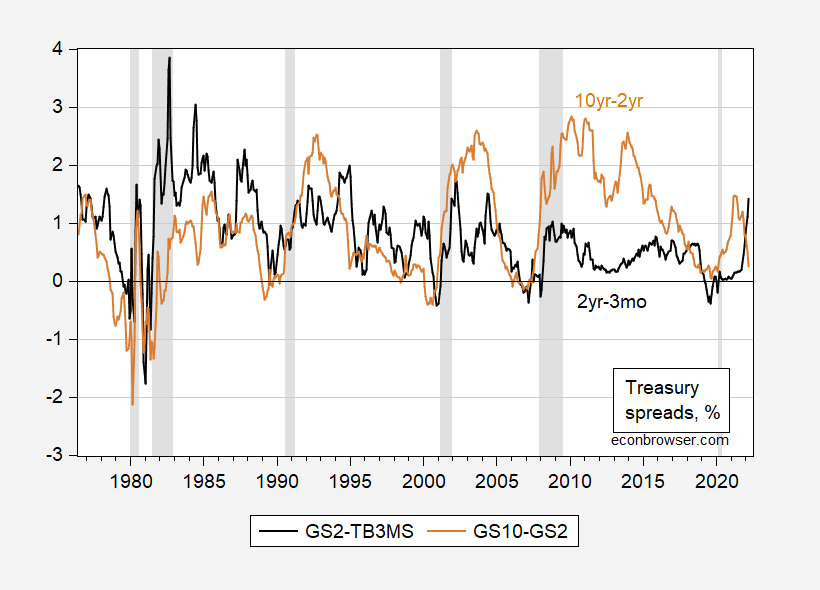
Figure 3: 10 year – 2 year Treasury spread (brown), 2 year – 3 month spread (black), all in %. 3 month Treasury is on secondary market. NBER defined recession dates peak-to-trough shaded gray. Source: FRED, NBER, and author’s calculations.
It’s hard to identify such a combination preceding recession.


Comments
Log in or sign up to join the conversation.