
It’s the method described in this intriguing paper, by William Kinlaw, Mark Kritzman, and David Turkington. From the abstract:
The authors introduce a new index of the business cycle that uses the Mahalanobis distance to measure the statistical similarity of current economic conditions to past episodes of recession and robust growth. Their index has several important features that distinguish it from the Conference Board’s leading, coincident, and lagging indicators. It is efficient because as a single index it conveys reliable information about the path of the business cycle. Their index gives an independent assessment of the state of the economy because it is constructed from variables that are different than those used by the NBER to identify recessions. It is strictly data driven; hence, it is unaffected by human bias or persuasion. It gives an objective assessment of the business cycle because it is expressed in units of statistical likelihood. And it explicitly accounts for the interaction, along with the level, of the economic variables from which it is constructed.
I have never used this metric myself (I seem to recall there used to be a stats blog with the name). To save you the trouble of googling “Mahalanobis distance”, here is Wikipedia’s description:
The Mahalanobis distance is a measure of the distance between a point P and a distribution D, introduced by P. C. Mahalanobis in 1936.[1] It is a multi-dimensional generalization of the idea of measuring how many standard deviations away P is from the mean of D. This distance is zero if P is at the mean of D, and grows as P moves away from the mean along each principal component axis. If each of these axes is re-scaled to have unit variance, then the Mahalanobis distance corresponds to standard Euclidean distance in the transformed space. The Mahalanobis distance is thus unitless and scale-invariant, and takes into account the correlations of the data set.
The KKT index over time is shown here:
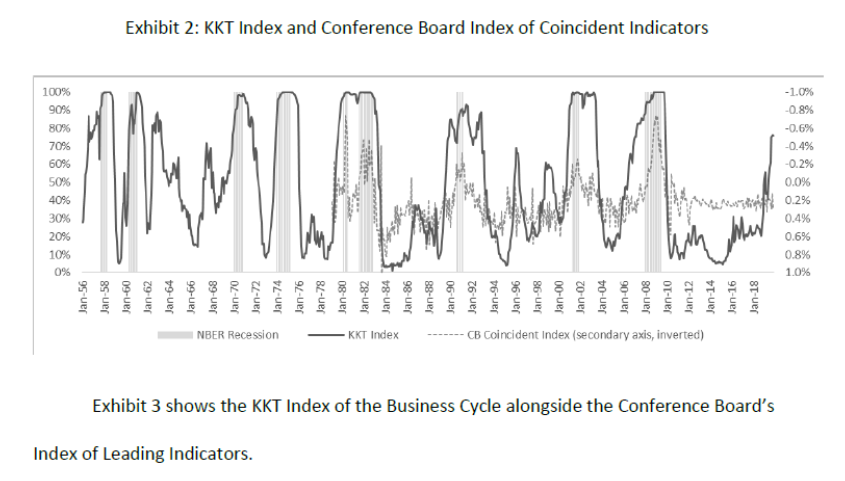
The last observation in the data sample used is November 2019; the KKT index value for that month is 76. Using the below table:
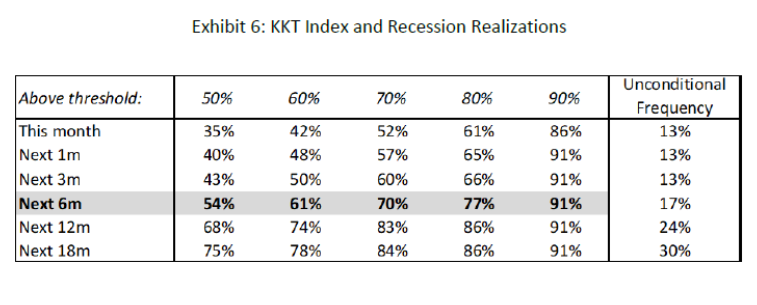
On finds that the implied recession probability in the six months after November 2019 is 70%, and for the 12 months after is 86%.
The paper includes a comparison to the yield curve (they use 10yr-Fed funds instead of 10yr-3mo as I do). It would’ve been useful (for me) to see what is the optimal threshold to use, as would a receiver operating characteristics curve indicate, or barring that, other summary information about false positives in a format recognizable to those who work on recession prediction.
(Also useful to note that yield curve slope is one of the divergent signals, so to the extent that “this time is different” because of a negative term premium, one might want to caveat the conclusions. In other words, we are assuming historical correlations hold true now.)


Comments
Log in or sign up to join the conversation.