

Overall, the global equity bull market rages on, and with supportive-benign macro the path of least resistance is likely higher. That said, VIX seasonality and known tail risks suggest still having a plan and process on the risk management front…
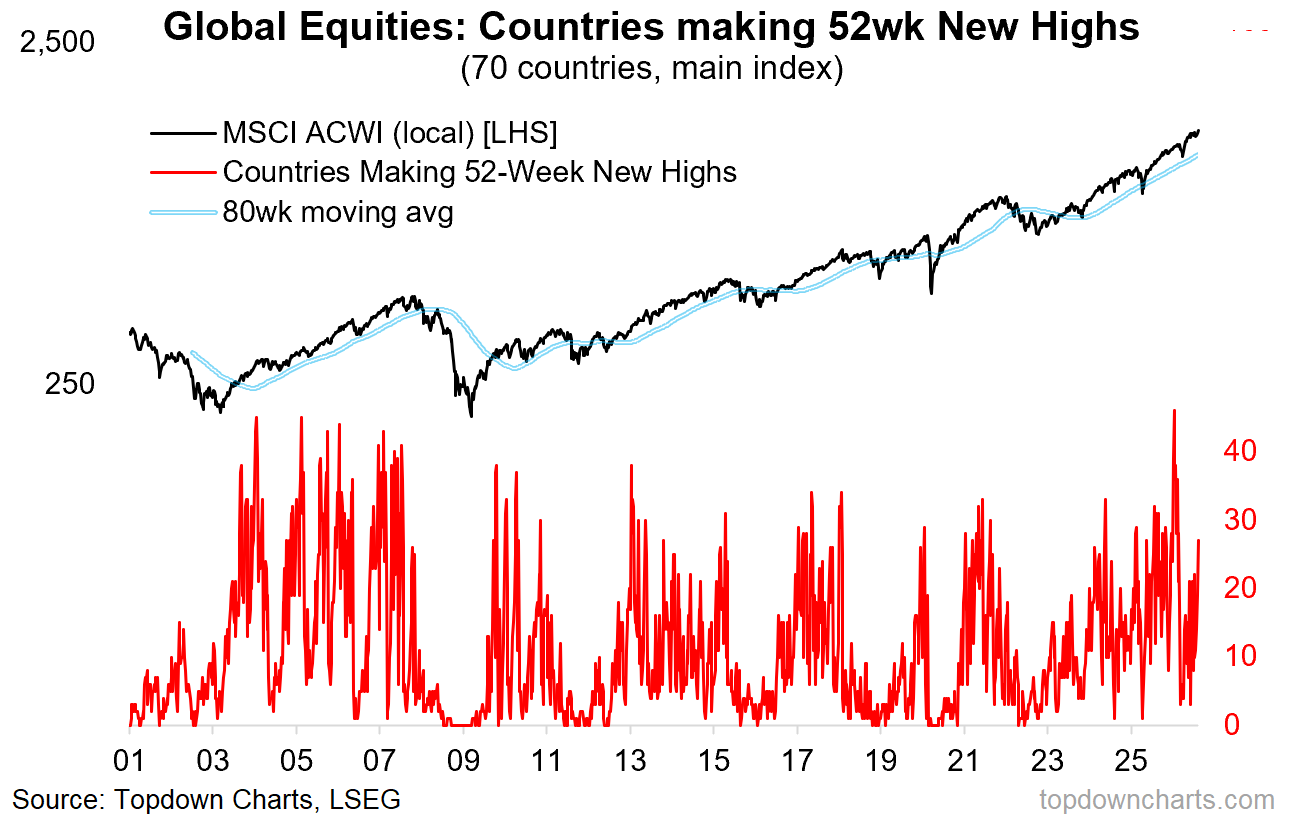
1. Global Equity Bull Market: global equities remain in a fully-fledged bull market with 40% of countries chalking-up new 52-week highs (and zero new lows). While things can turn faster than you expect and shocks can appear out of nowhere, this is a picture of strength and the path of least resistance is higher.
Source: Topdown Charts Professional
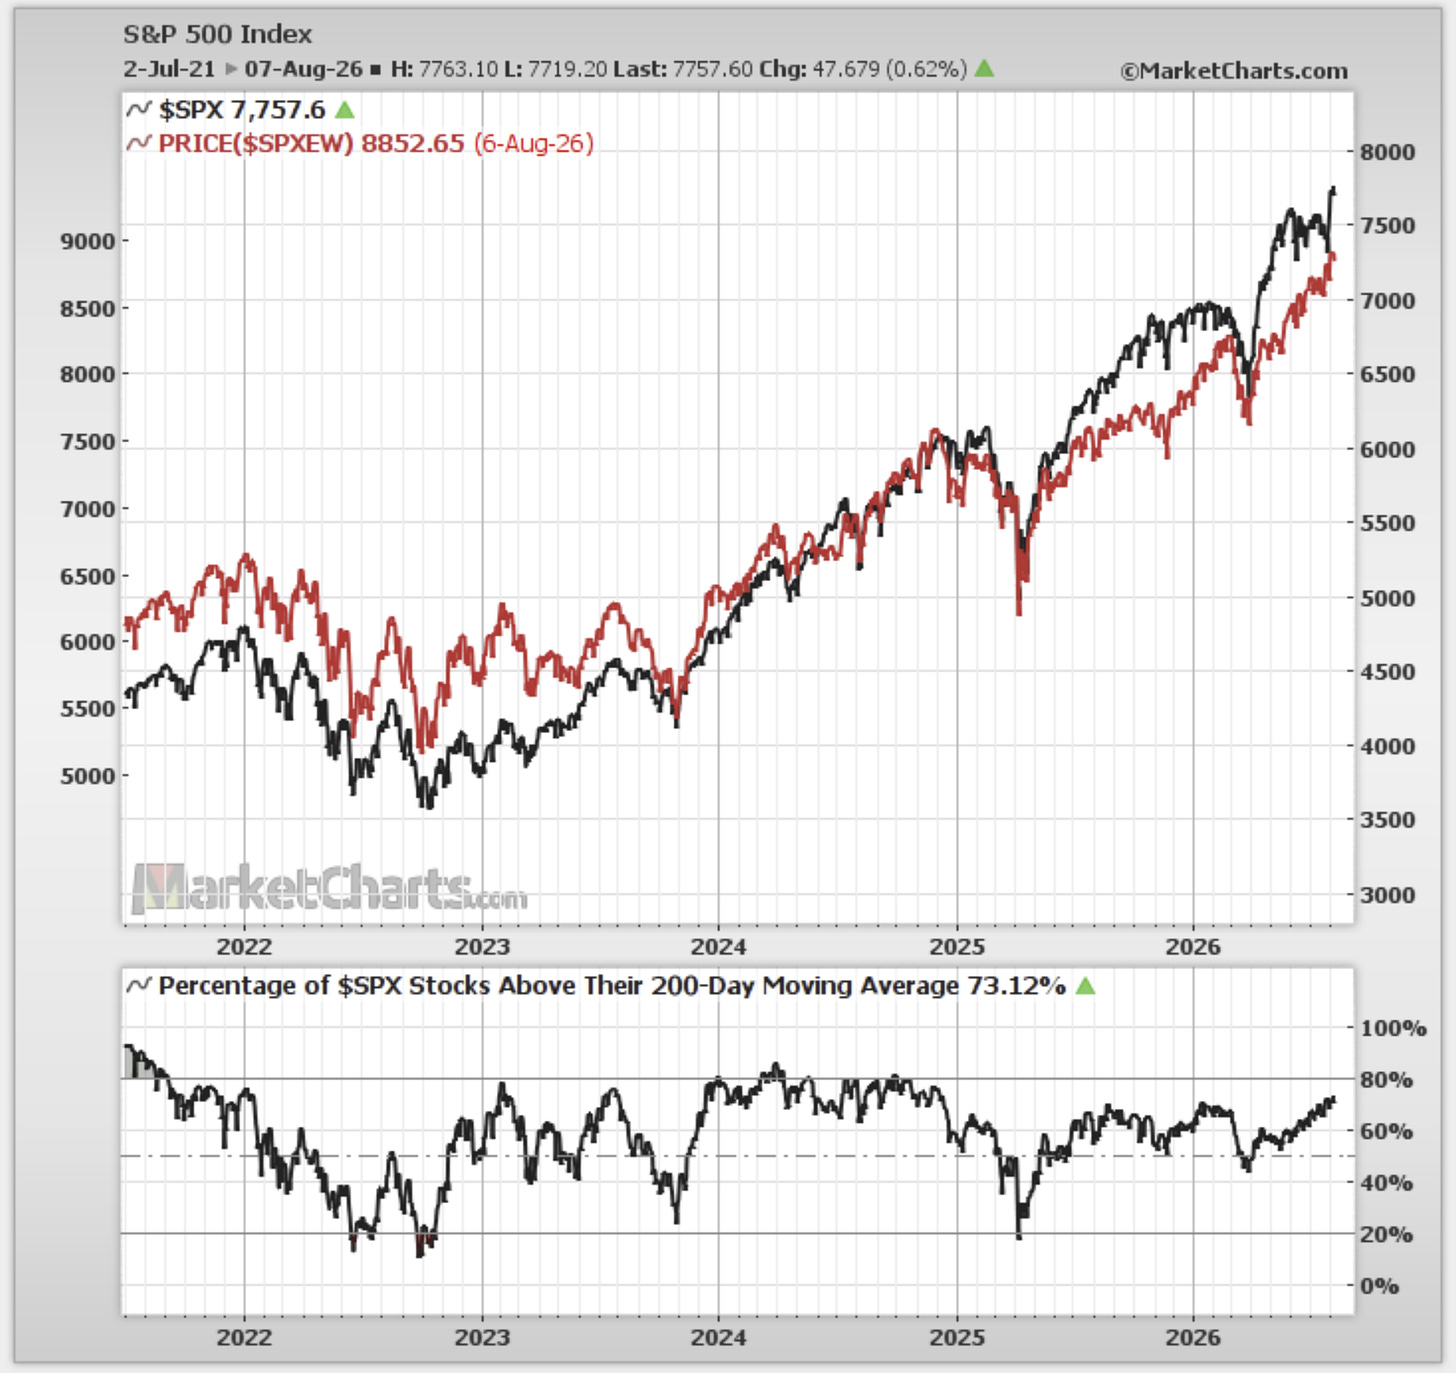
2. Onwards & Upwards: back in the USA it’s the same sort of thing. The equal-weighted index has been steadily pushing higher and 200-day moving average breadth trending up —and now, after a period of consolidation and ranging, the cap-weighted index is also out to new highs.
Source: MarketCharts.com (link to editable chart)
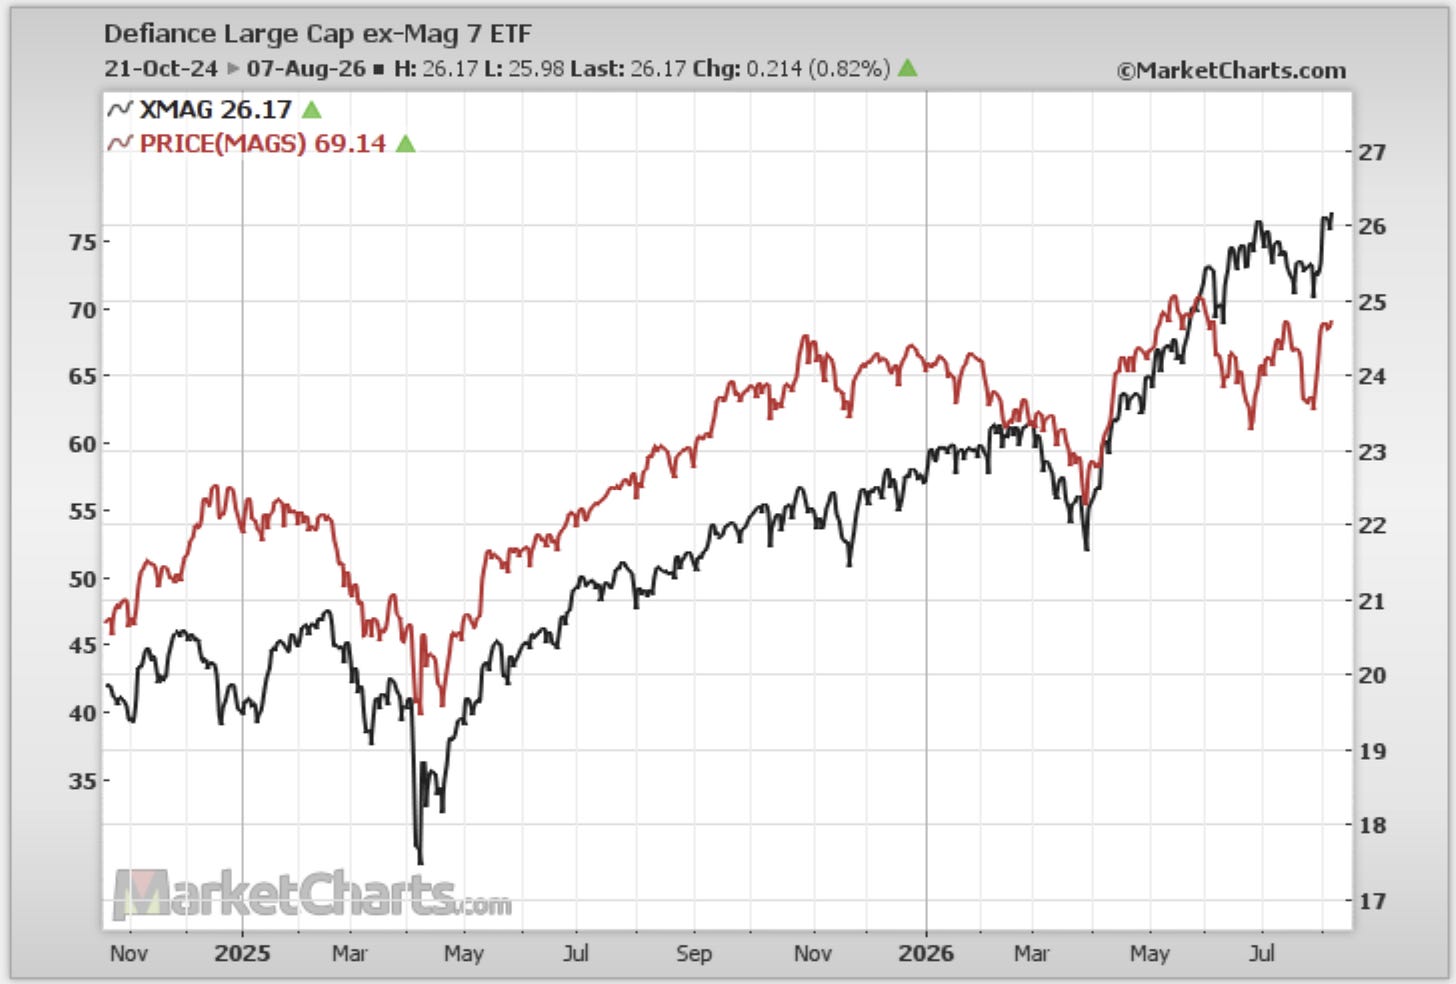
3. MAGS Up: both Mag-7 and ex-Mag-7 have quickly snapped back from the lows. Another victory for dip-buyers.
Source: MarketCharts.com
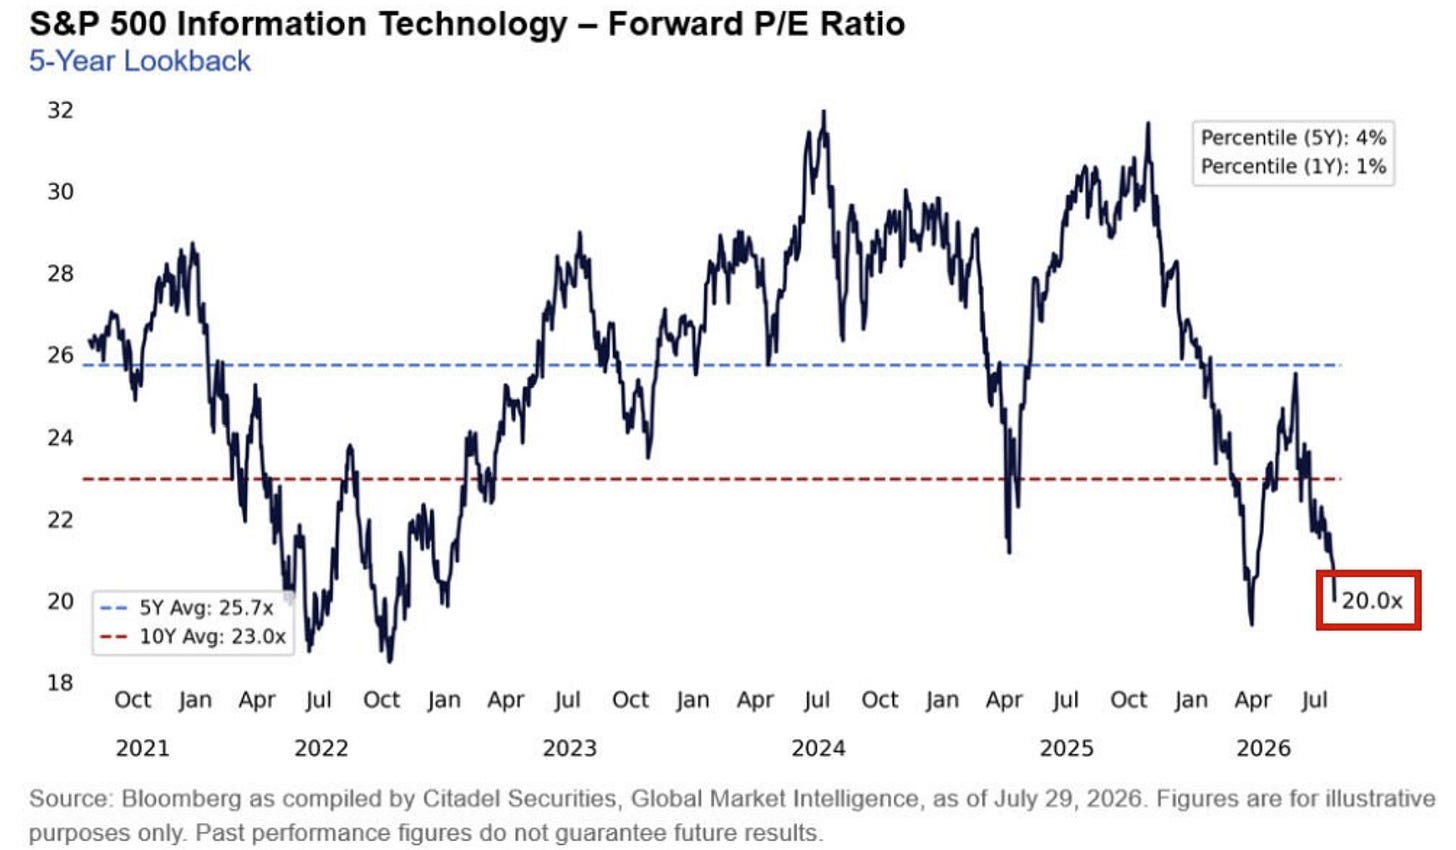
4. Tech Cheap? with tech stocks stuck in the range over the past few months, ever-enthusiastic analyst earnings expectations have continued higher and higher… and hence tech is cheap on a Forward P/E basis.
Source: @MacroCharts
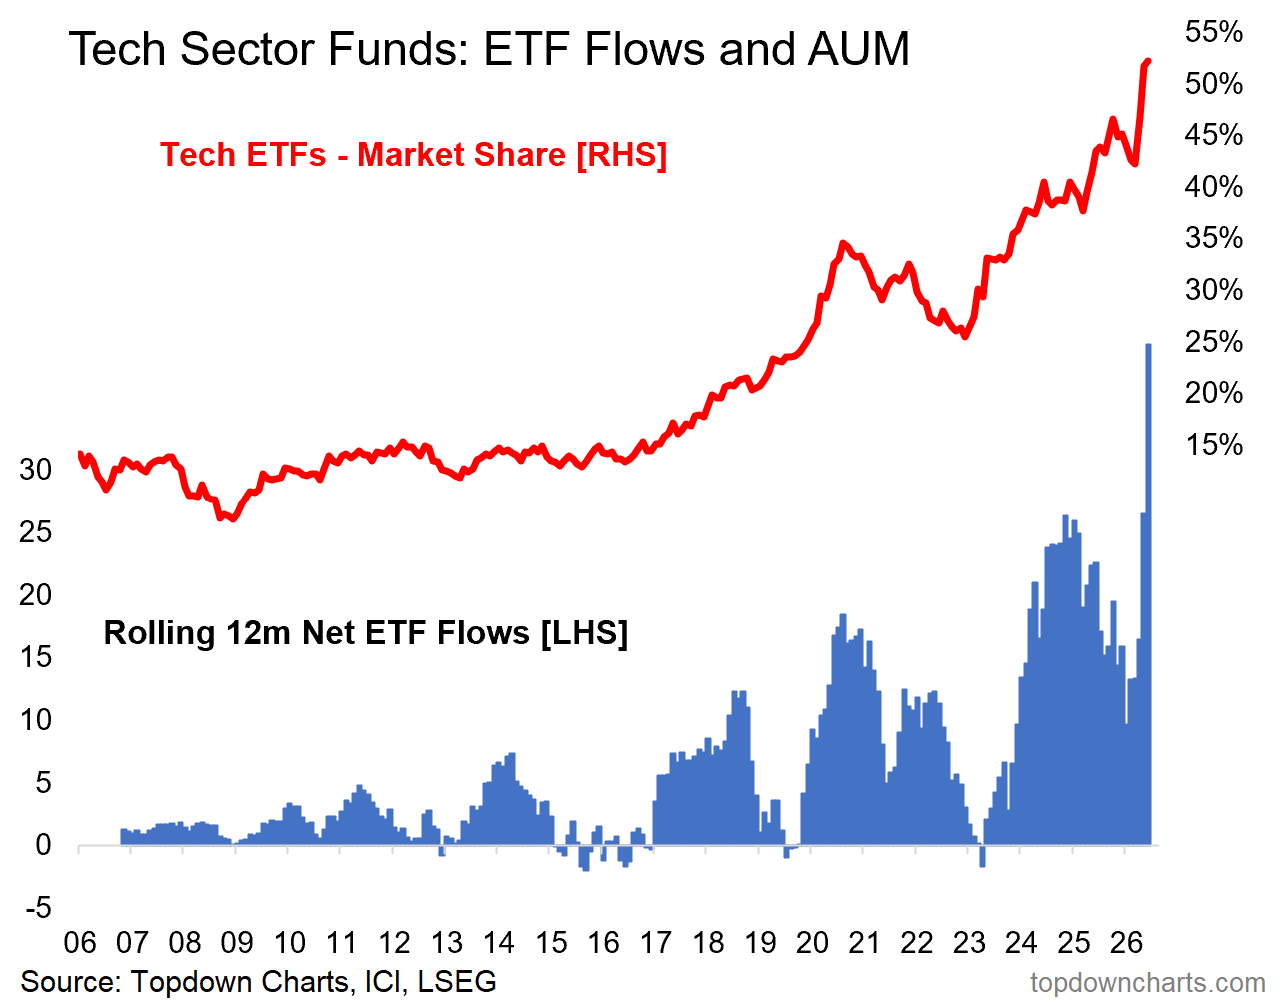
5. The Techening: despite or because of this, investors have piled into tech stocks at an accelerating rate, and implied allocations to tech ETFs have surpassed 50%.
Source: Topdown Charts

Comments
Log in or sign up to join the conversation.