


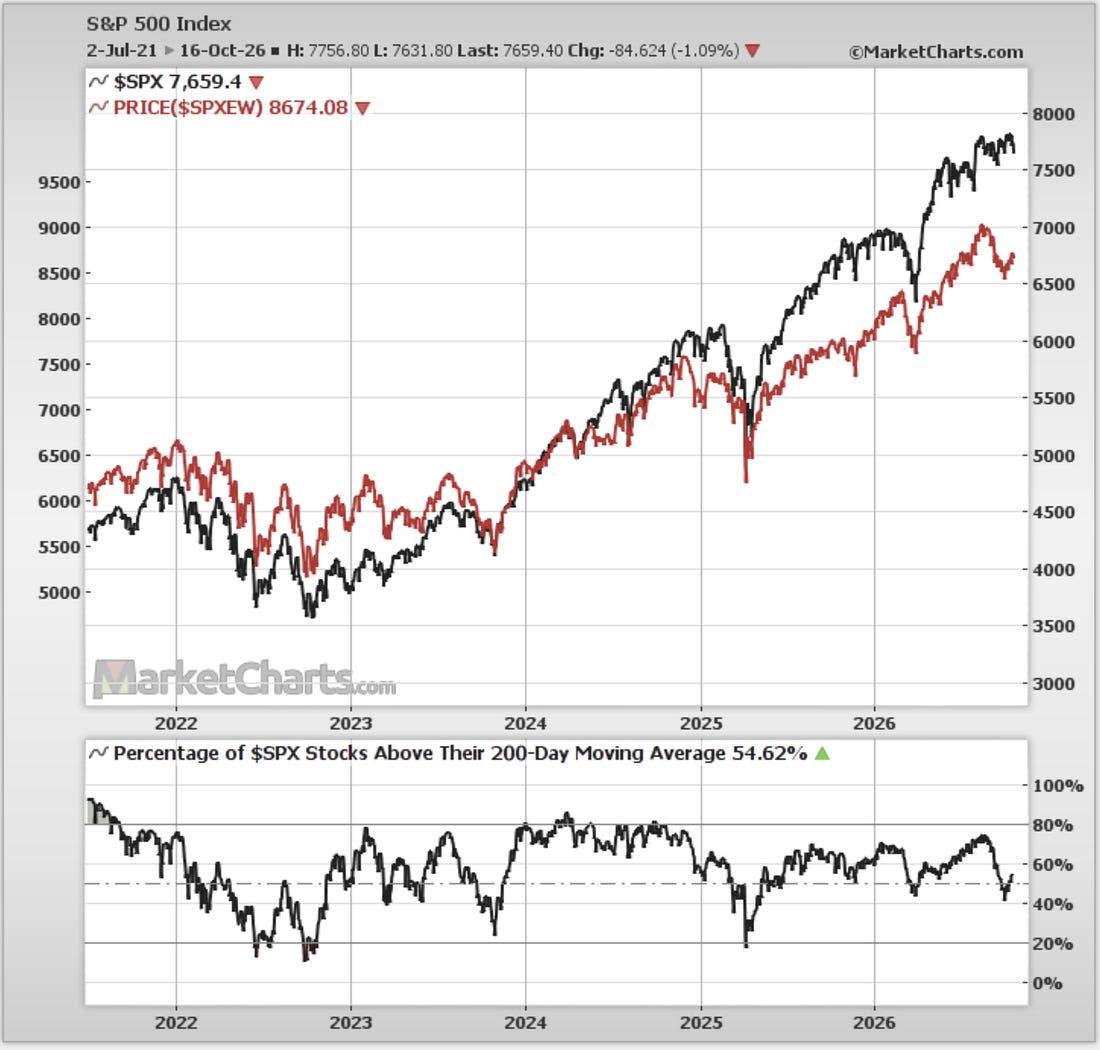
1. S&P500 Mixed Picture: it’s more of the same mixed picture with the S&P500 cap-weighted (headline) index chopping about; this week held back by semiconductors (e.g. SMH down -10% and the chips-heavy KOSPI down -15%). But meanwhile breadth is healing and the equal-weighted S&P500 is now +3% up off the lows.
 |
Source: MarketCharts.com
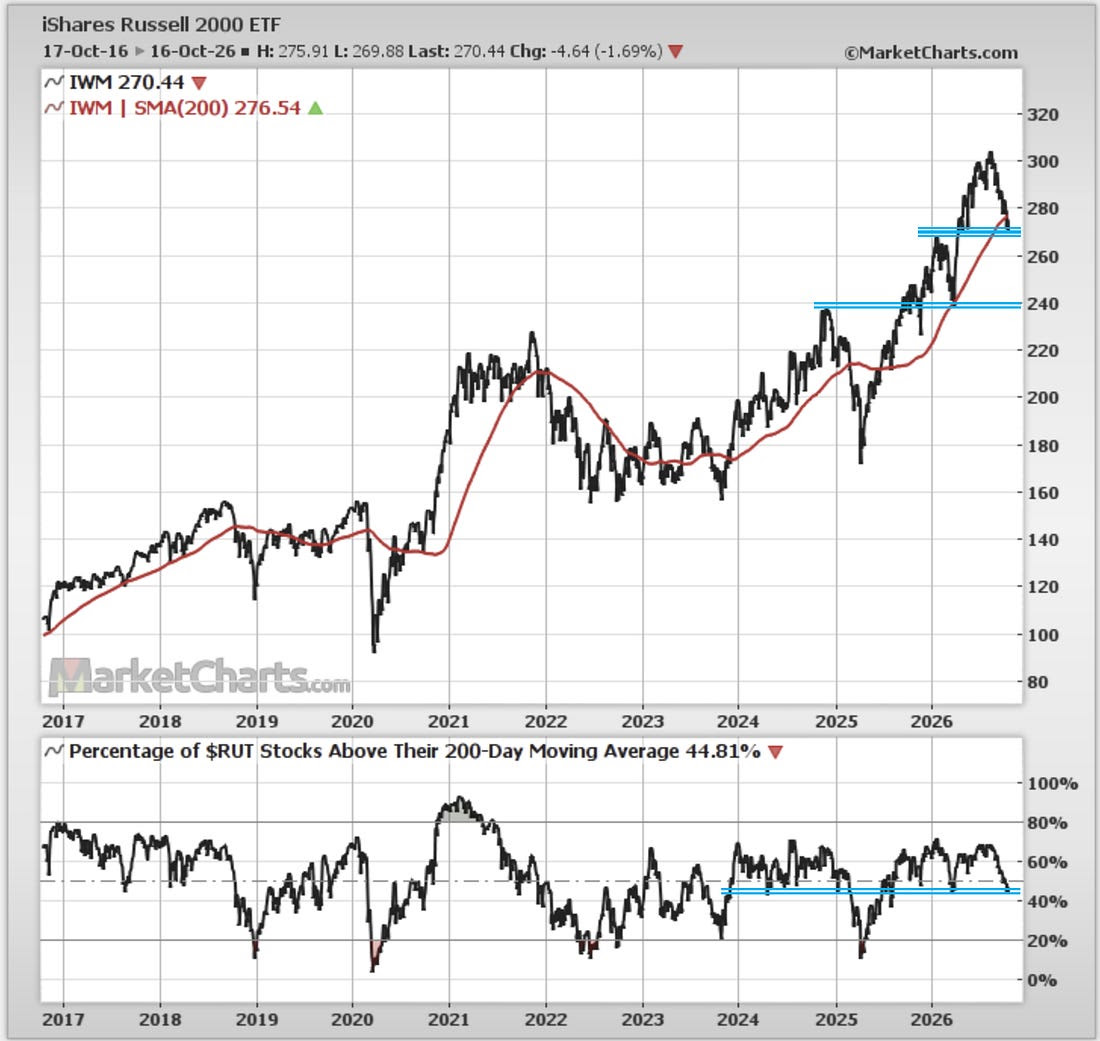
2. Small Cap Correction: also under pressure is US small caps, dropping -3% last week, now down -11% off the high. That’s a big correction for small caps, and brings them back down to a major make-or-break support level (200dma breadth is likewise hovering around a key support).
 |
Source: Weekly Macro Themes Report — 16 October 2026
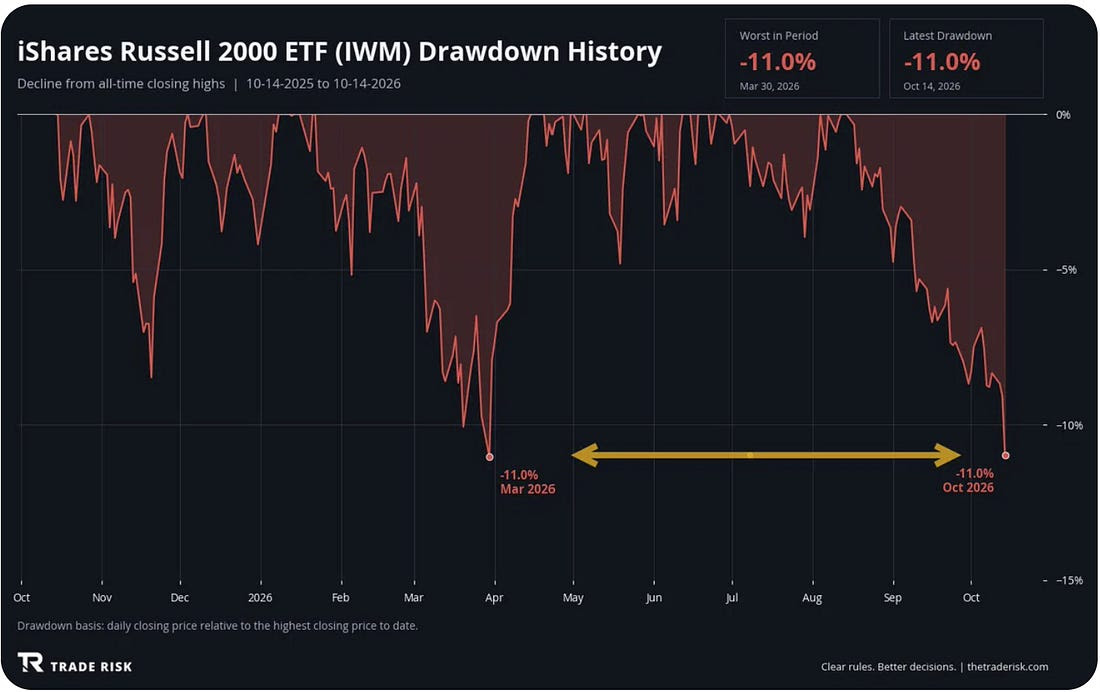
3. Small Cap Crush: the Sep/Oct small cap correction has now exceeded the Q1 Iran-War correction and has scuppered already skeptical sentiment on small caps.
 |
Source: @evanmedeiros
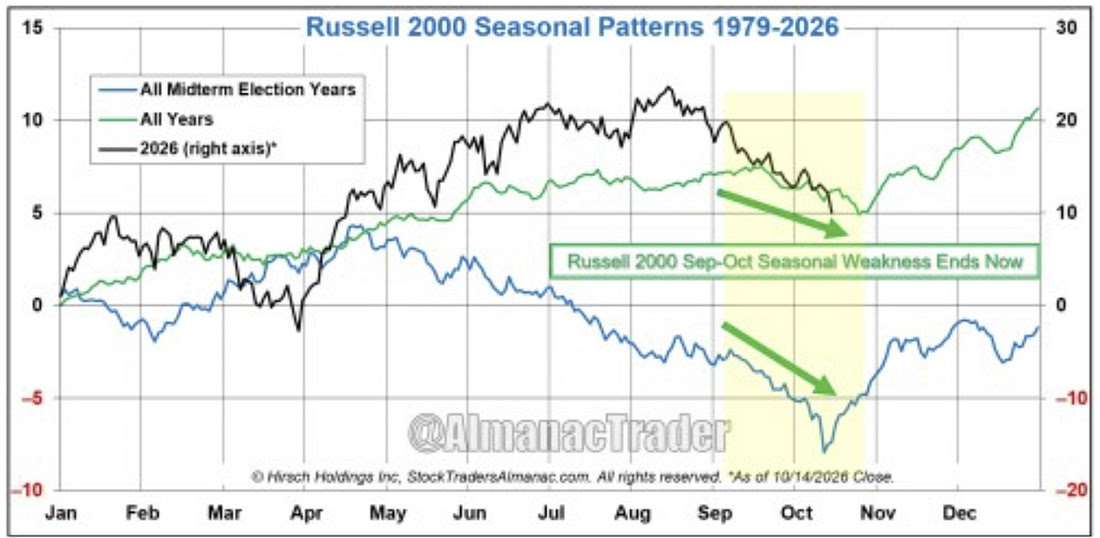
4. Small Cap Seasonality: but one reason, besides the big reset back to support, for optimism on small caps is after going through what is typically a weak part of the year for small caps, seasonality is turning up (particularly the case for midterm election years).
 |
Source: Russell 2000 Seasonal Weakness Ends Now
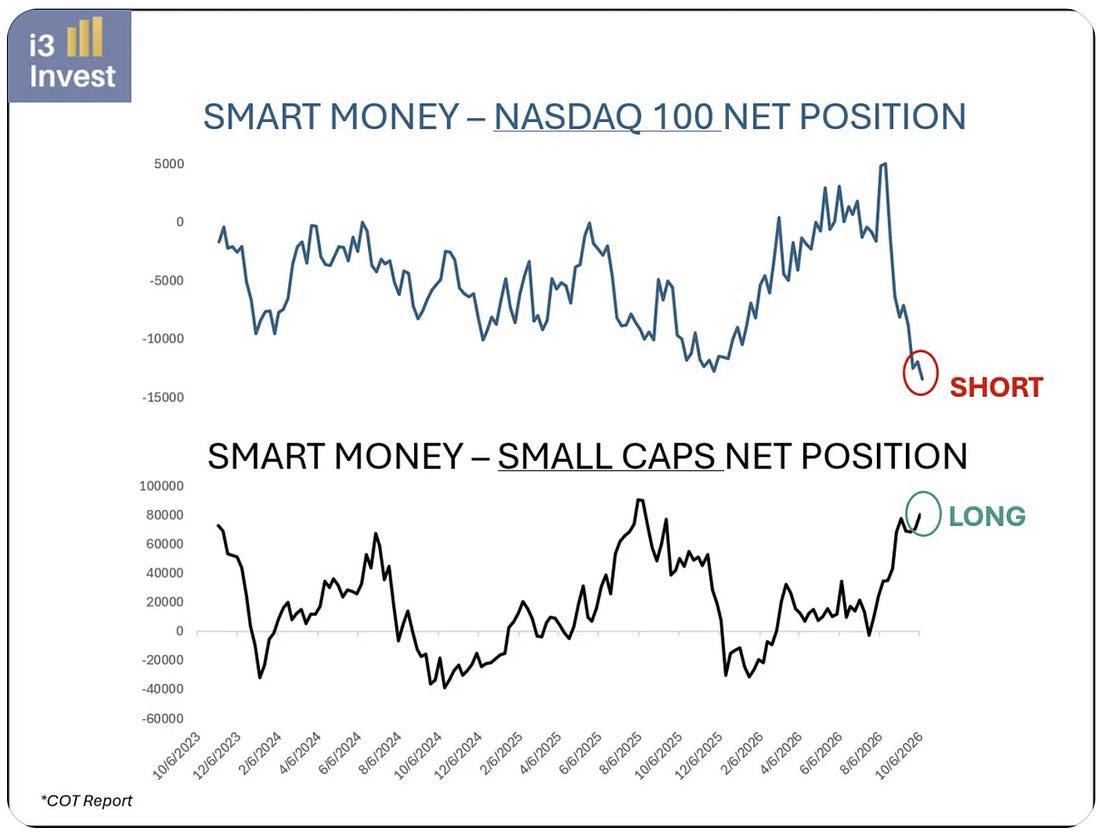
5. Smart Money Positioning: interestingly we’ve also seen a big shift in smart money positioning to big shorts in big tech and sizeable longs in small caps.
 |
Source: @i3_invest
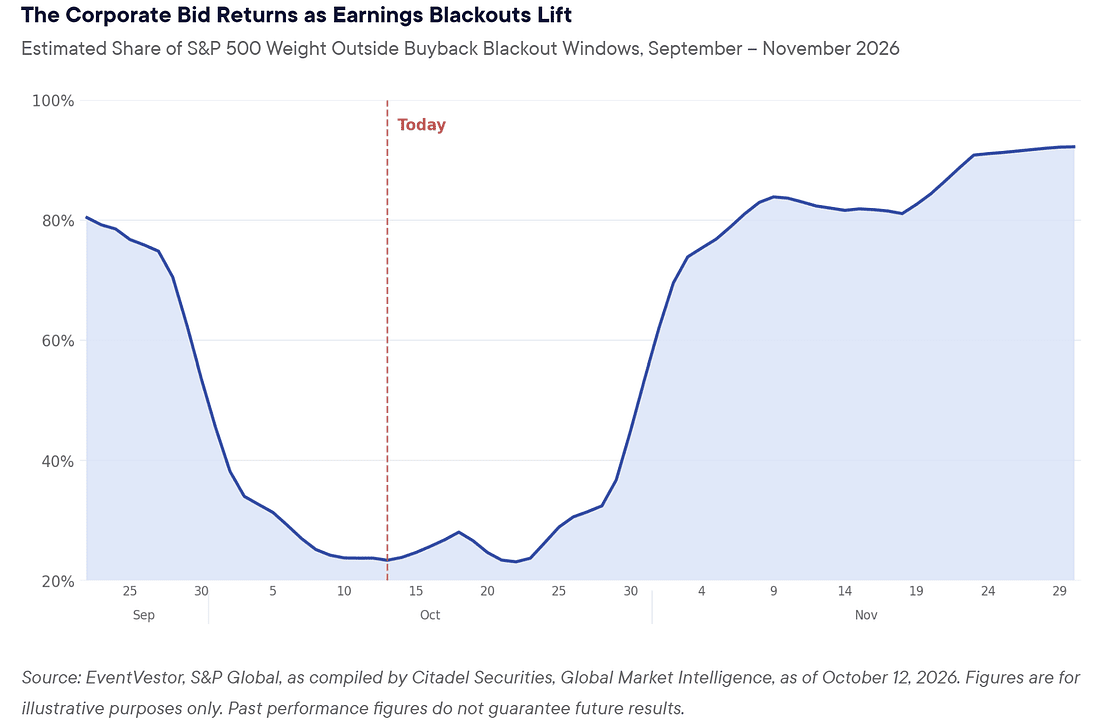
6. Buybacks Come Back: more for the larger end of town, buyback blackouts are set to lift in the final week of October (reinforcing the seasonal updrafts we typically see into November).
 |
Source: October Update: Fundamentals in Focus
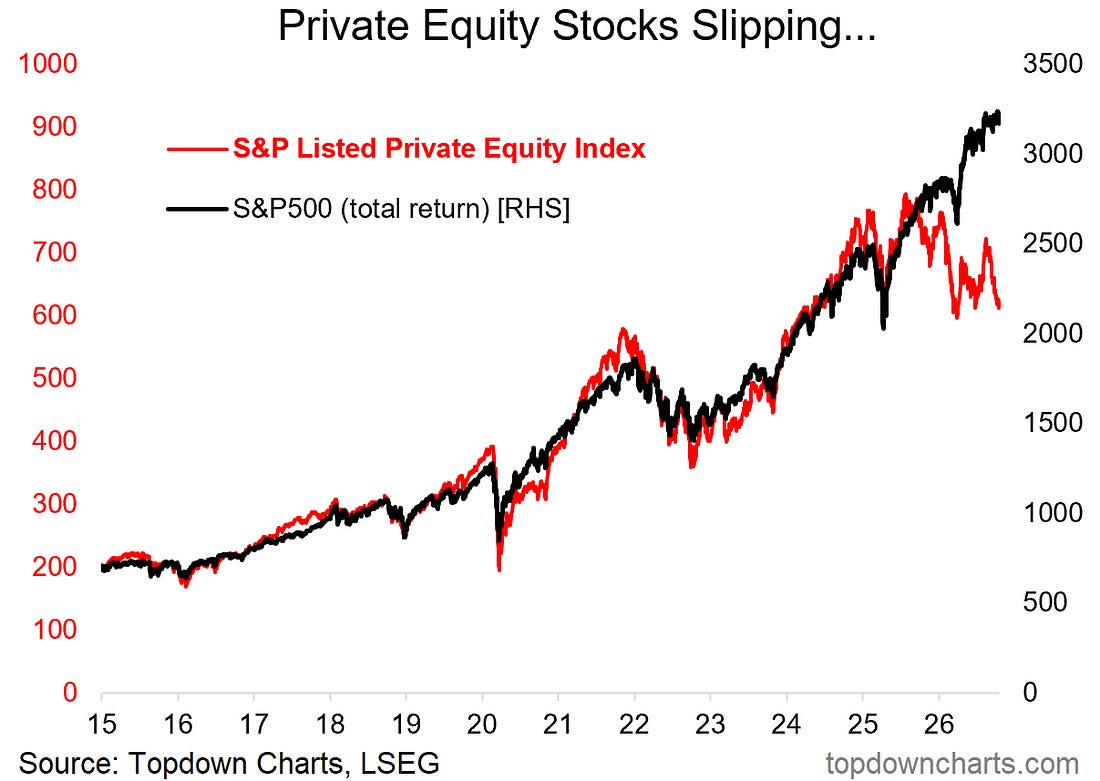
7. Private Equity Portend? One issue of note is how private equity stocks remain under pressure (p.s. watch out on this one if it breaks that key support level). This reflects the concerns on private credit, the saturation of flows into private equity, and higher rates putting pressure on the old high-debt model.
 |
Source: Topdown Charts Professional
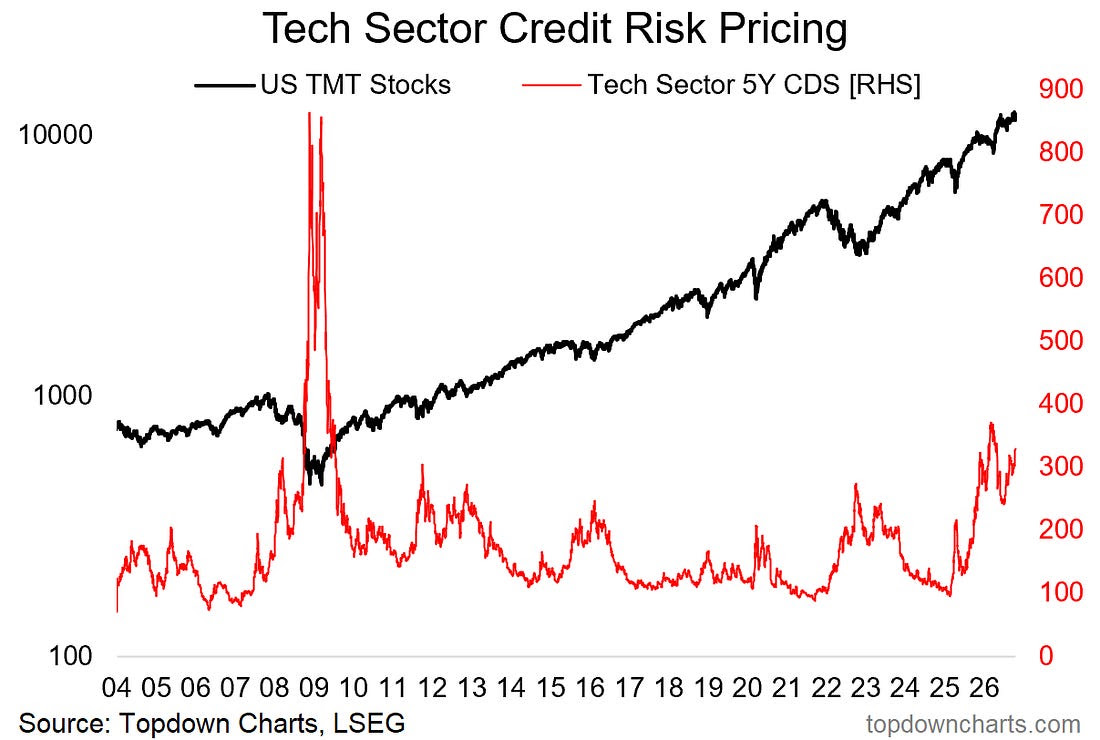
8. Tech CDS on the Rise Again: speaking of high debt and credit markets, credit risk pricing for tech names continues to rise (seeing a surge in CDS pricing for telecoms and media too). Expect more of this as AI capex drives a pivot from cash flow to credit, and tech disruption trickles through tech-related sectors.
 |
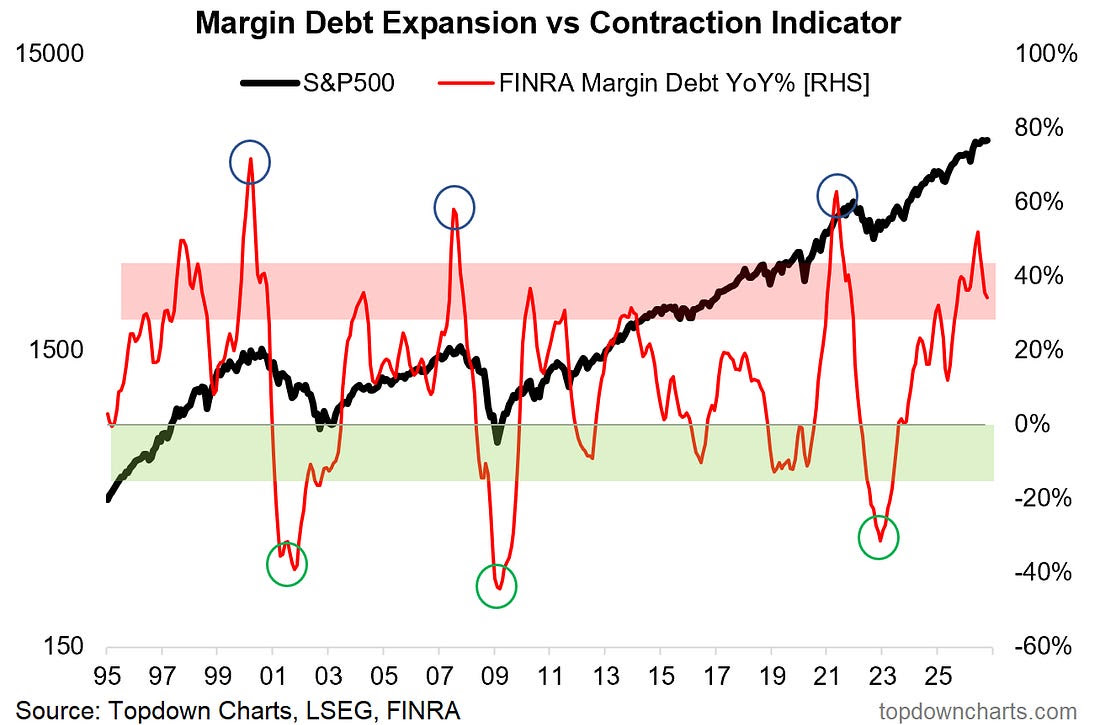
9. Margin Debt Growth Fading: and over to investor borrowing, the margin debt acceleration indicator is still in warning mode (reached very high levels and then rolled over). The only hope from a signal standpoint would be that it gains a second wind and delays the fall.
 |
Source: Topdown Charts
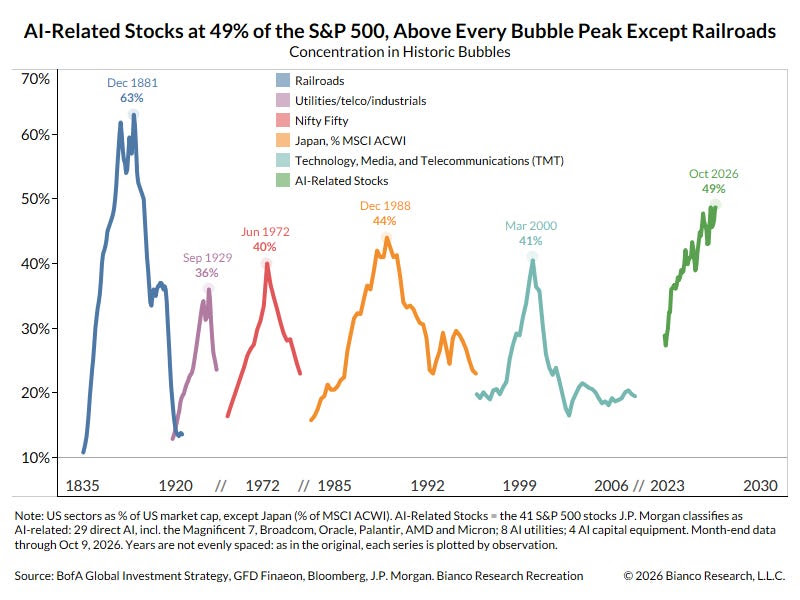
10. Concentration Bubbles: seems AI-related stocks have climbed to about 50% of the index; this draws parallels to some previous major stockmarket booms that likewise saw surging concentration. (then again, some might argue rails set a precedent for how far it could still yet go…)
 |
Source: The S&P 500 Increasingly Looks Like Two Stock Markets
US Stockmarket Outlook: 5-factor framework
The current outlook features elevated background risk (i.e. expensive valuations, bullish sentiment, record high investor allocations to equities), but sufficient offsetting factors for now (economy is doing fine, earnings growing, uptrend intact).
The key swing factor is policy [which is currently neutral but on a tightening path], meanwhile earnings/macro will also be under increasing scrutiny [currently strong, but leading indicators starting to sour].
Overall stance: pragmatically bullish, closely monitoring risks.
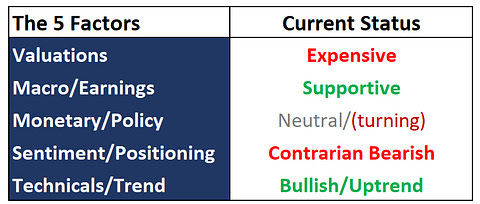 |
Weekly ChartStorm Strategy Table: the table above uses the Topdown Charts 5-Factor Framework for analyzing macro and markets to give an overall assessment on the US Stockmarket.
Factor in Focus — Sentiment & Positioning
Sentiment and positioning tell us a few key things about the market outlook. When sentiment/positioning is one-sided it represents a large number of minds that could change given the right reason (therefore = future potential buying/selling).
Sentiment also maps to the market cycle; sentiment reaches extremes toward the end and beginning of the cycle —so it tells us information about where we are in the cycle. But sentiment also tells us about momentum e.g. traveling up from extreme bearish early in the cycle is actually quite bullish, whereas extreme bullish sentiment later in the cycle is more of a bearish signal.
Here’s some examples.
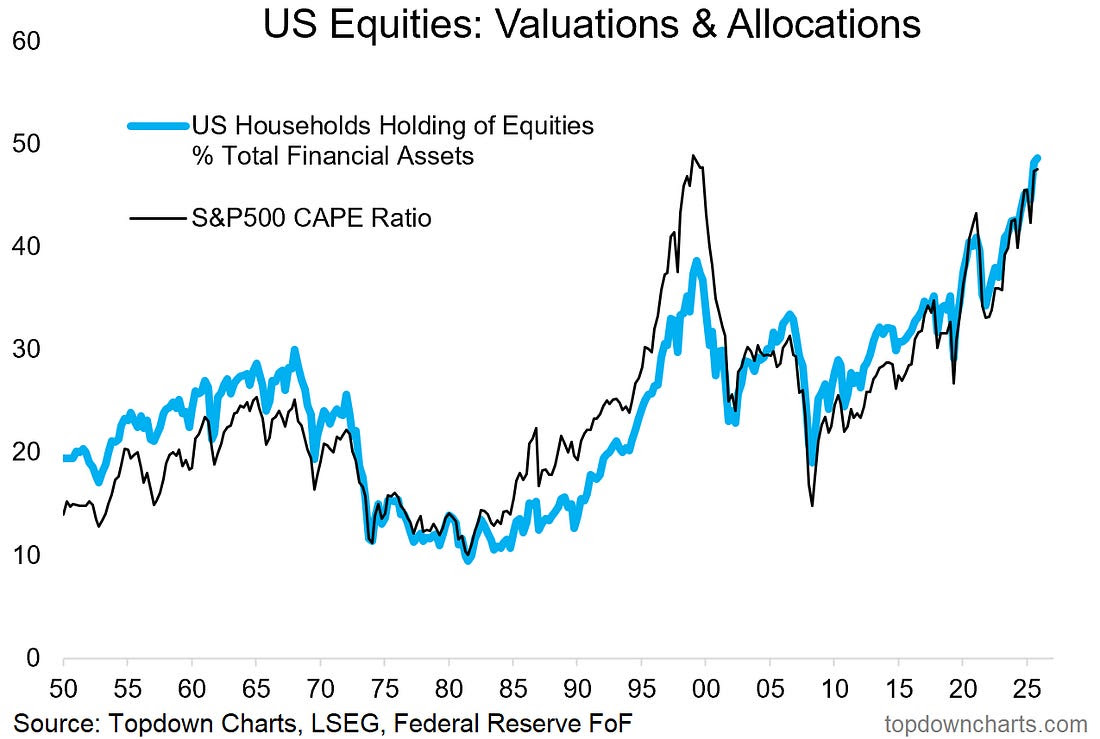
Positioning (investor allocations): investor asset allocations tend to be slower moving, but tell us important information about what investors are doing, and how much capacity they might have to either raise or reduce allocations (as well as the wealth-effect impacts of changes in stock prices).
For example where things are at right now investors appear to be basically all-in. This is what it looks like late in the cycle, and when things are at an extreme (US household portfolio allocations to equities are at an all-time high).
 |
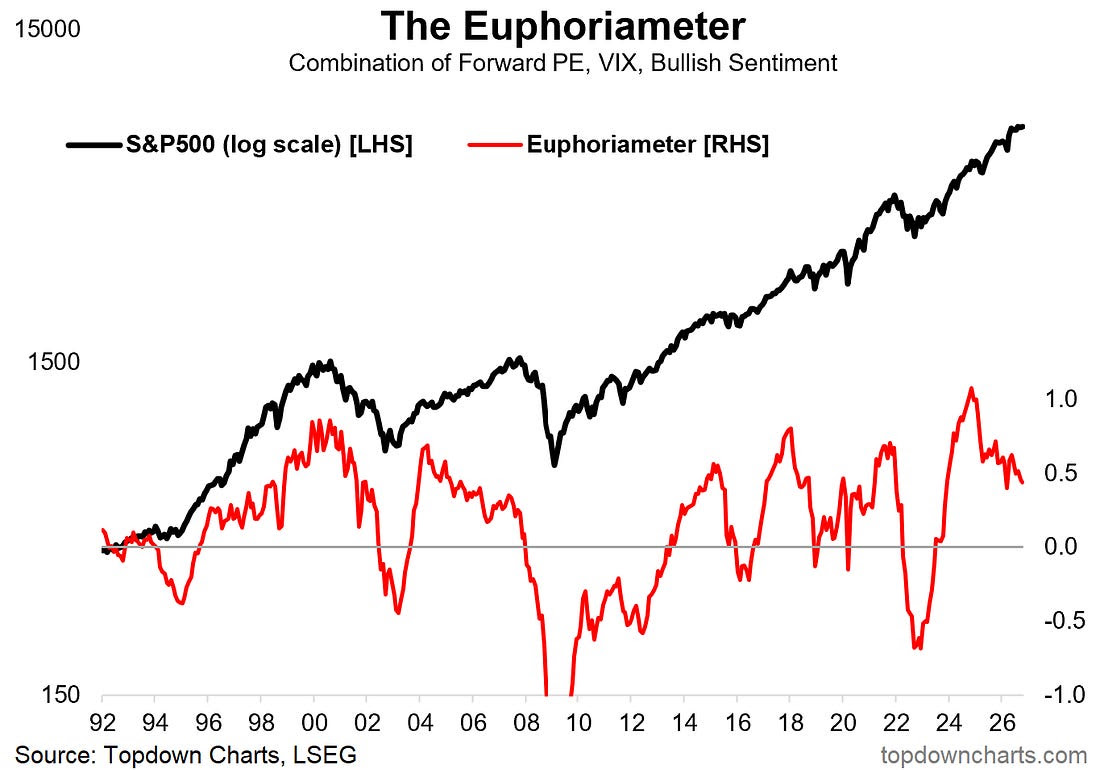
Slow sentiment (smoothed/composite): the below sentiment indicator combines the signal from surveys and market pricing + smooths the data to give more of a cycle view of sentiment. Currently it’s elevated but trending down.
 |
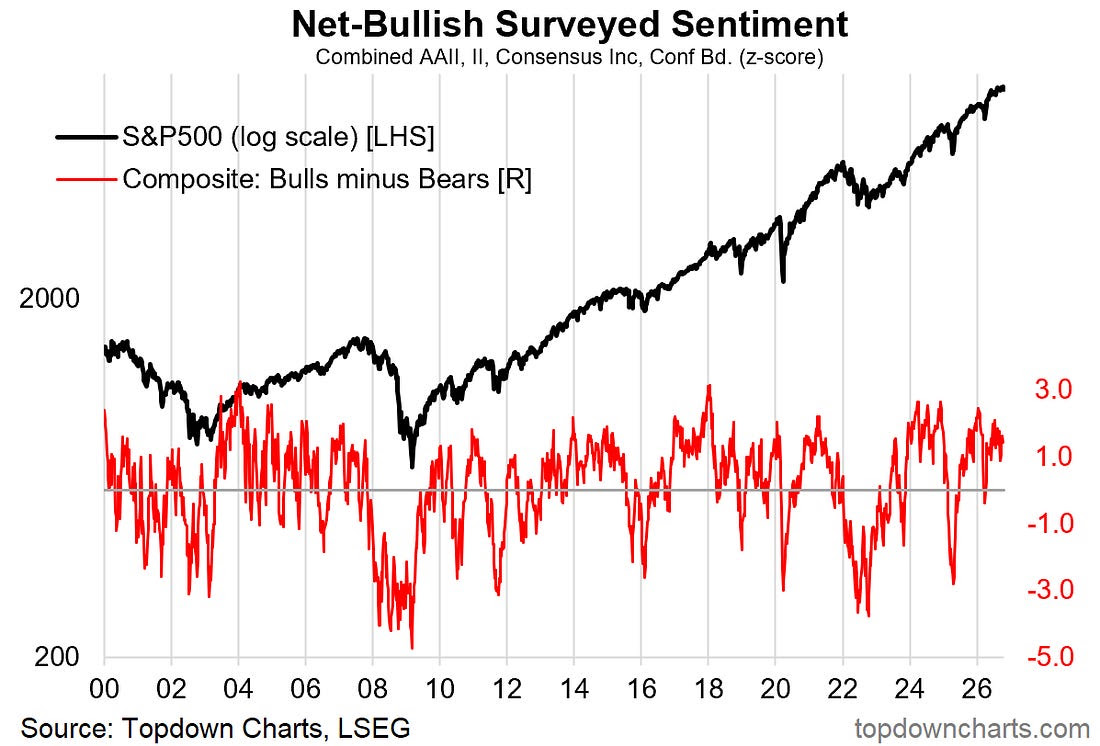
Fast sentiment (weekly surveys): as another angle, this combined view of investor sentiment surveys looks a lot choppier and reacts faster with the ebb and flow of the market. This one is also ticking lower from consensus bullishness.
 |
So the overall picture is one of consensus bullish sentiment and extreme high allocations to equities. This is why I noted sentiment to be currently contrarian bearish and a sign of heightened background risk (potential selling if all the bulls find reason to change their mind to bearish/defensive).
Again though, you need a catalyst/excuse such as tighter monetary conditions, weaker earnings/macro, and/or a breakdown in the technicals.
This tells us the pragmatic stance (bullish bias for now), and what things we need to be tracking as bearish/downside triggers …but also that we should have a plan for the next stage (and start thinking about defense and diversification).

Comments
Log in or sign up to join the conversation.