

Semiconductor Stocks
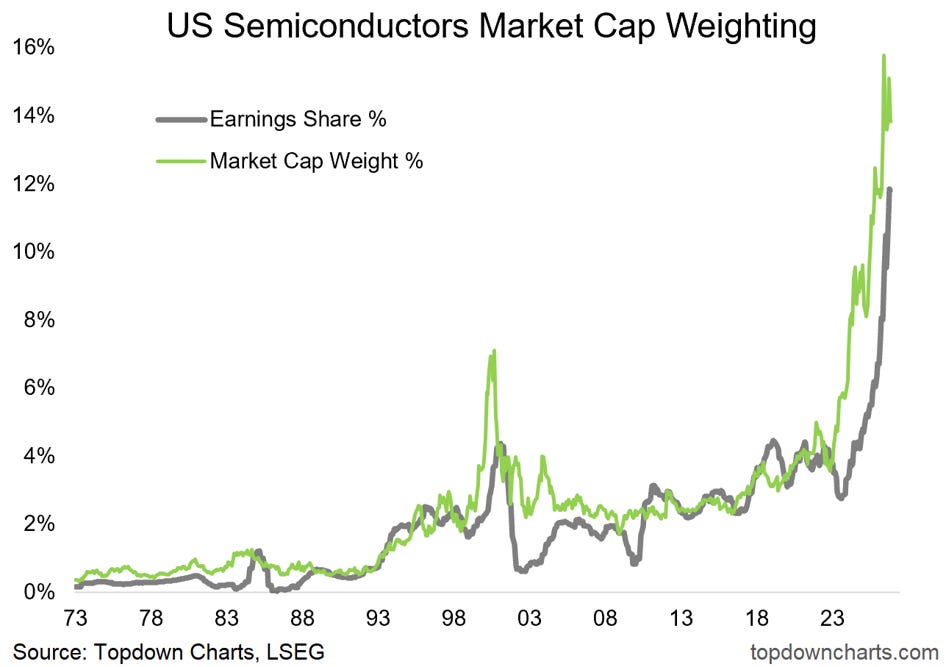
Depending how you look at it, this may be one of the most bullish or bearish charts out there on US semiconductors… and by extension one of the most important charts for the US stock market right now.
US Semiconductors’ market cap weighting has surged to record highs.
It brings immediate comparisons to the dot-com spike, but equally immediate counterpoints on how the earnings weight has also soared — the mantra is: it’s different this time because it’s backed by earnings.
But take a quick look at the chart… the dot com boom was backed by a surge in earnings weight too. So too was the lesser-known 1980’s semiconductor boom-bust cycle. This is a sector where boom and bust is the rule, not the exception (and a natural feature of disruptive tech adoption).
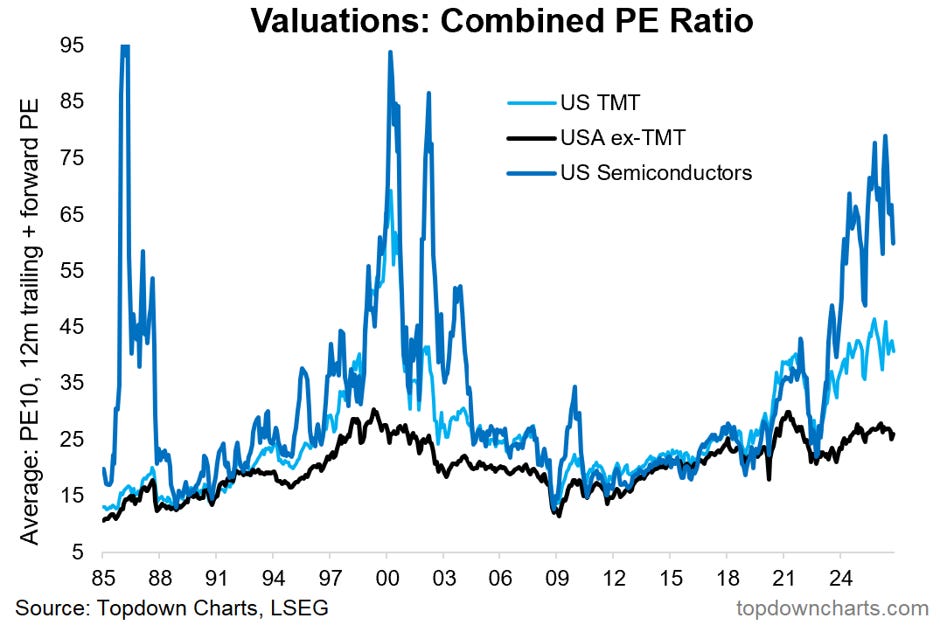
Bonus Chart: US Equity Valuations…
Similar to Korean Equities (as discussed last week), US semiconductors’ combined PE ratio soared to levels similar to those seen during some of the previous major boom/bust cycles. Basically this is the gap between market cap weight and earnings weight, and it represents the anticipation aspect…
i.e. in the chart above the green line leads the grey line on the way up —the earnings story does justify the move in stock prices, but the current level of earnings matters less than the expectation of the future level of earnings.
That’s where things can get unstuck. The more you bid up valuations, the greater the scope for disappointment if earnings fall short of expectations …or even worse: if the earnings boom turns to bust (either through a period of overinvestment vs immediate-term demand, or through an economic downturn [or both]).
As I’ve said before: “Bulls, Booms, and Bubbles start with good reason, and end when things get unreasonable...”


Comments
Log in or sign up to join the conversation.