

 Learnings and conclusions from this week’s charts:
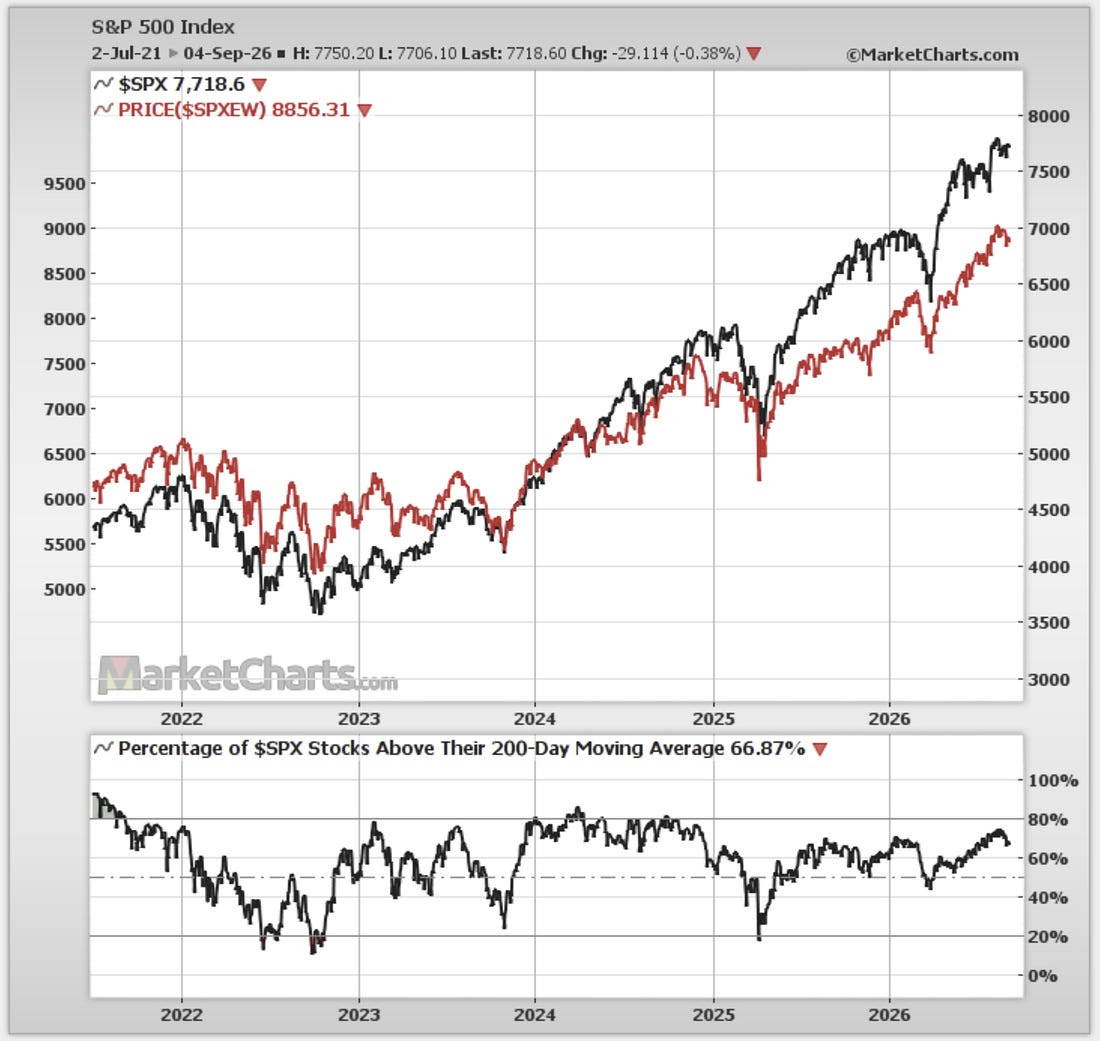
Overall, there are clearly some short-term wobbles underway, and aside from seasonality there are a few risks to the downside (the well-understood vulnerabilities like valuations, allocations, sentiment, and catalysts like the Fed). But there is an interesting upside scenario to ponder (in the Portfolio Strategy Notes section)… Quick answer: The S&P 500 has been stumbling since mid-August, which seasonally comes right about as you would expect. Credit markets are whispering a couple of concerns (tech, CCCs), profit margins have reached a record high driven by tech, and investors should beware of boom-bust in tech and AI as borrowing blooms. 1. The S&P Stumble: the S&P500 (both equal and cap-weighted versions) has been stumbling since mid-August, and breadth has rolled over from previously strong levels. This might just be noise, but it’s worth reflecting that many of the bigger downturns and corrections started with small weakness at first.
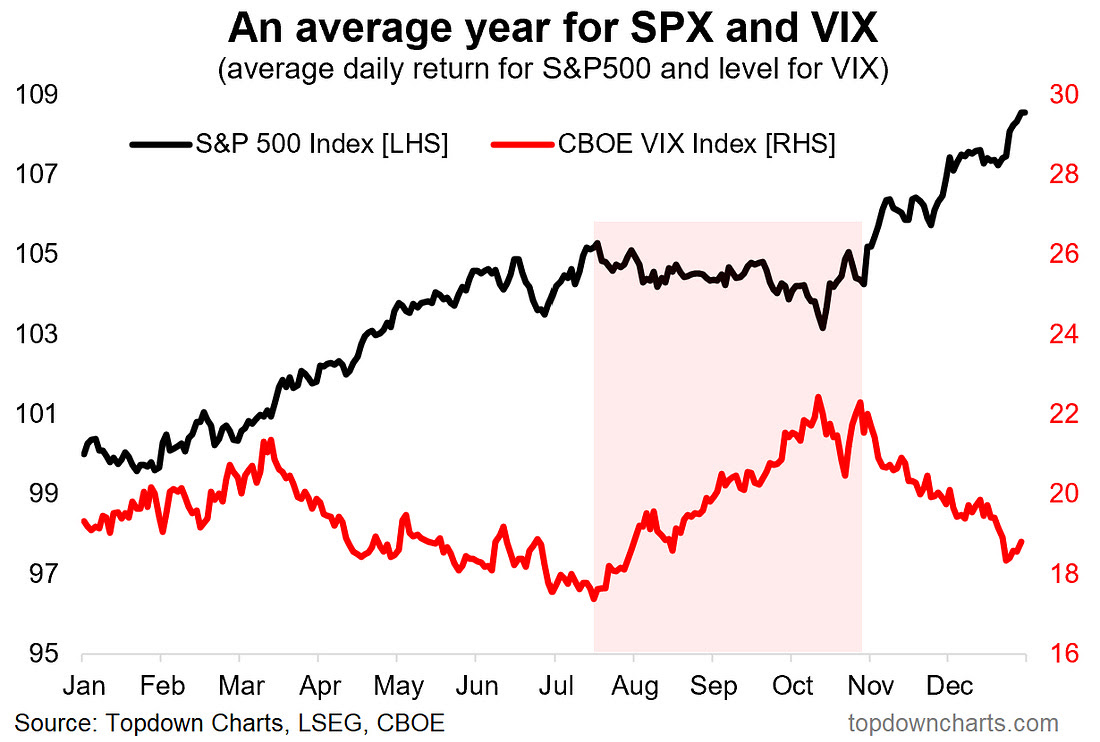
Source: MarketCharts.com 2. SPX & VIX Seasonal Map: from a timing standpoint, this is a very appropriate time of the year for the market to see some weakness — bulls will say that this explains some of the weakness we have seen, and there is nothing to fear as we will soon be into year-end rally territory. Bears will say that this is the first shot across the bow as we head into a seasonal correction from a starting point of overvaluation, overexposure, and an overly optimistic consensus.
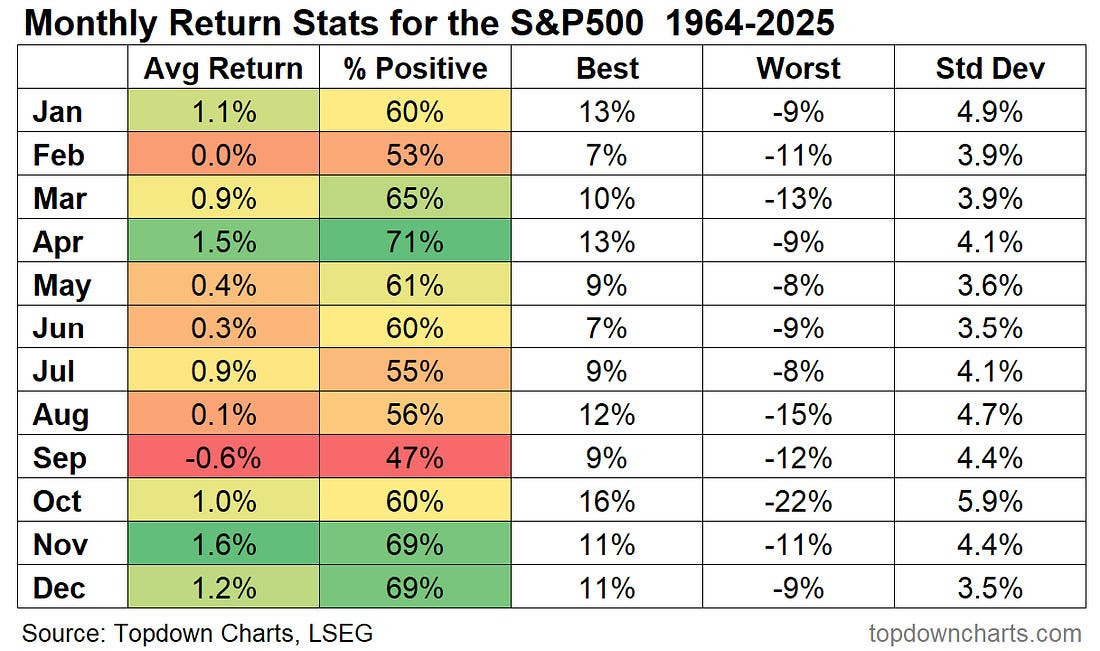
Source: Topdown Charts Professional 3. Month-by-Month Seasonals: looking at the monthly seasonal stats, September has historically been the worst month on average and has the smallest percentage positive. However, even then, historically September was negative 53% of the time (that’s close to a coin-flip), and its best month on record was +9%, so it’s not a done deal (and neither is the upside in Nov/Dec for that matter). But then again, we do have some softening in the technicals, and an overhyped market that is vulnerable to triggers (maybe Fed?).
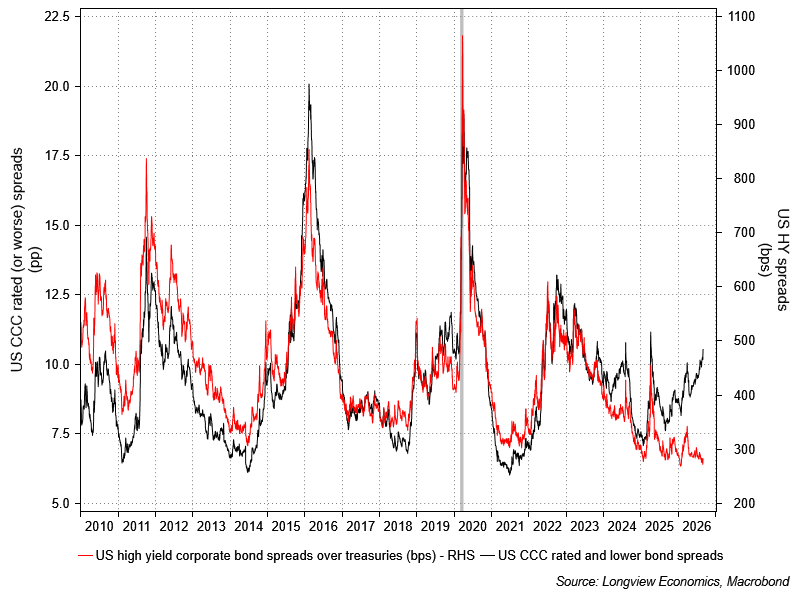
Source: Topdown Charts 4. Credit Check — what do you CCC? moving over to credit markets, there is a curious divergence between the lowest quality bonds and high yield credit spreads. This tells us that at least some portion of borrowers are being viewed with greater skepticism than usual by credit investors. The problem with weakness in the worst names is that it can sometimes spread and rippled across to those the market deems currently less risky.
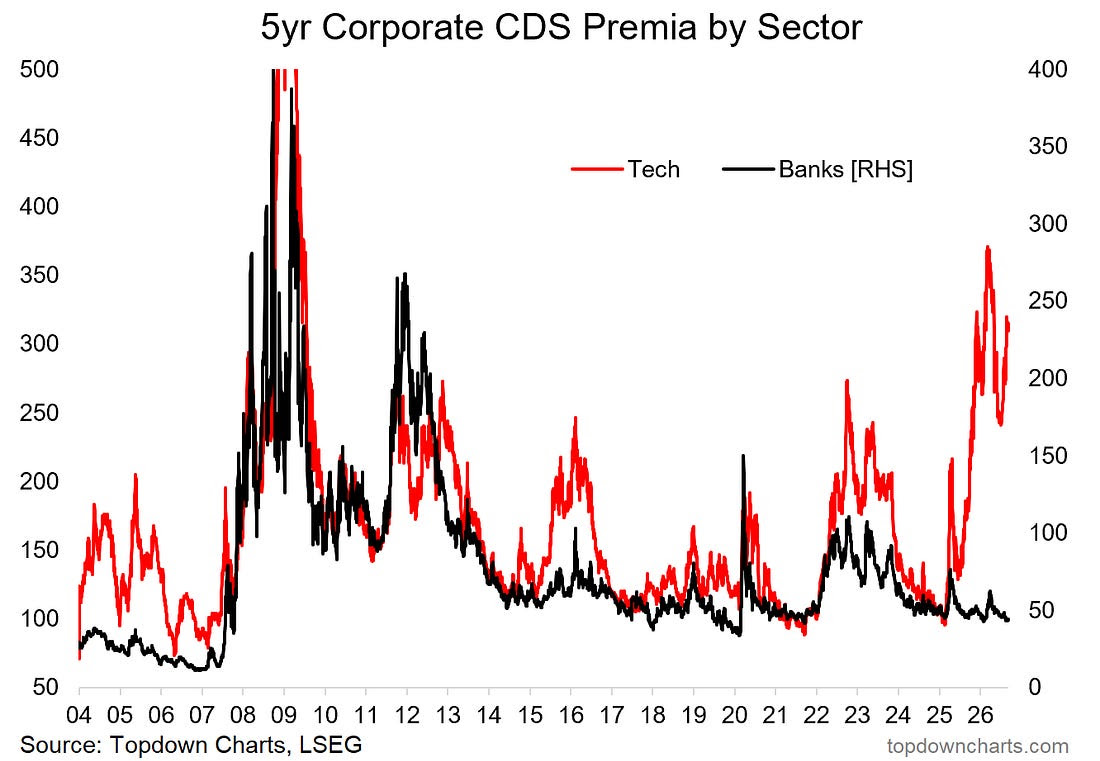
Source: @Lvieweconomics 5. Credit Check — Tech vs Banks: a similar divergence is playing out in Tech vs Bank sector CDS. Credit investors are treating tech borrowers with greater scrutiny, while banks are seen as lower risk than usual. This tells us that there are no systemic issues right now (calm on banks), but again, there are pockets of concern. If tech borrowers did start to default you can bet that will ripple across markets.
Source: Topdown Charts Pro |
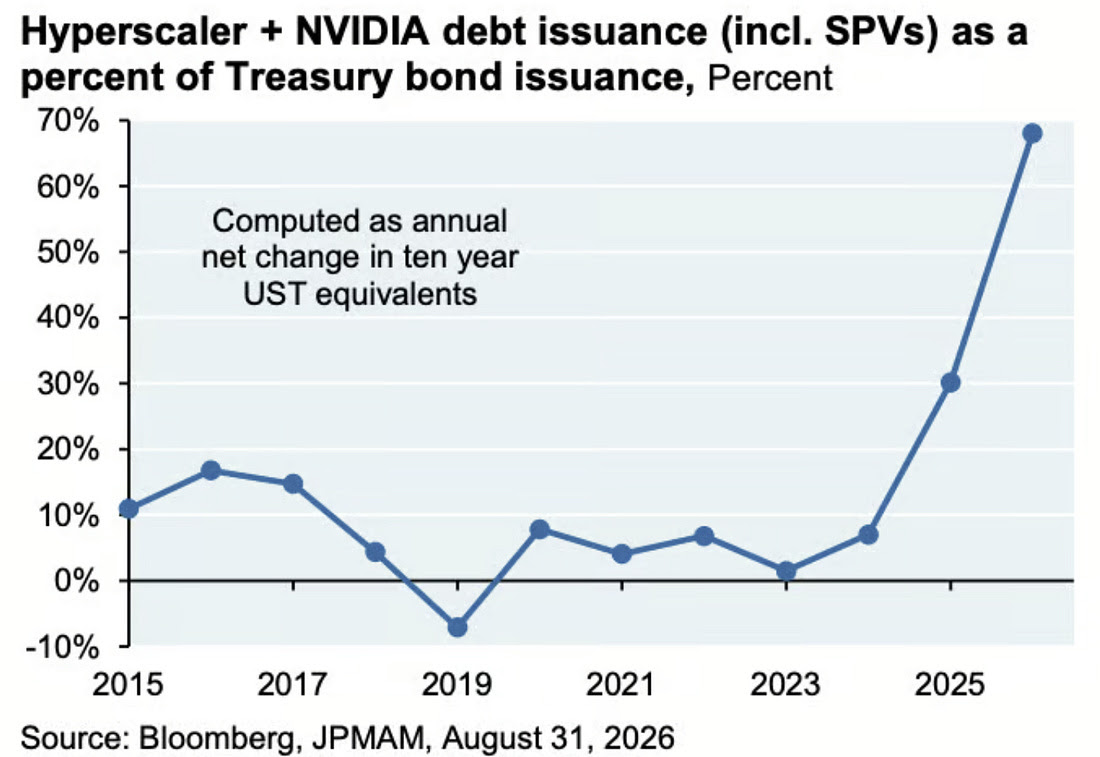
6. Hyperscaler Hyperspeed Issuance: speaking of tech sector borrowers, the Hyperscalers are issuing so much debt this year they are nearly outborrowing even the most profligate debtor of all — the US government! As Cembalest remarks: “Looking just at the long duration component in 2026, we estimate $310bn in ten year equivalents. That’s 70% (!!) of new Treasury long duration borrowing this year.”
 |
Source: JP Morgan via Daily Chartbook
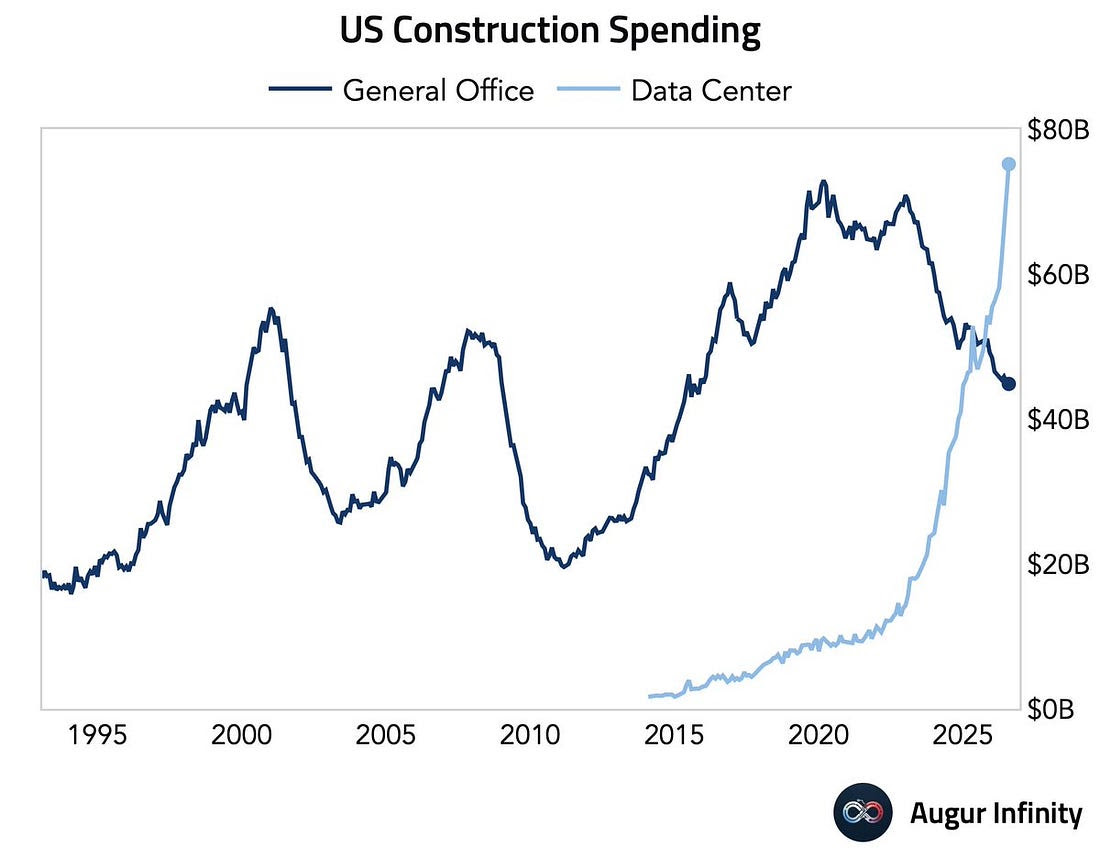
7. Construction Boom-Bust Cycles — Data Center Edition: it’s about this point we should talk to someone in a more “boring” old-economy sector like real estate… Construction is a boom-bust industry. By the time you get the price signal and conditions to build, there’s typically a shortage; and then a rush to build and try and profit. The tide eventually goes out as rates pop up, demand slumps (e.g. in recession), and/or supply ends up over-correcting and ending up with an excess. Then construction activity slumps (and so on, as the cycle repeats).
We’ve seen this elsewhere too, not just in real estate, but also in things like commodities e.g. the US shale-oil boom of the 2010’s. Boom-bust cycles are the rule of the economic jungle. This too shall bust.
 |
Source: @AugurInfinity
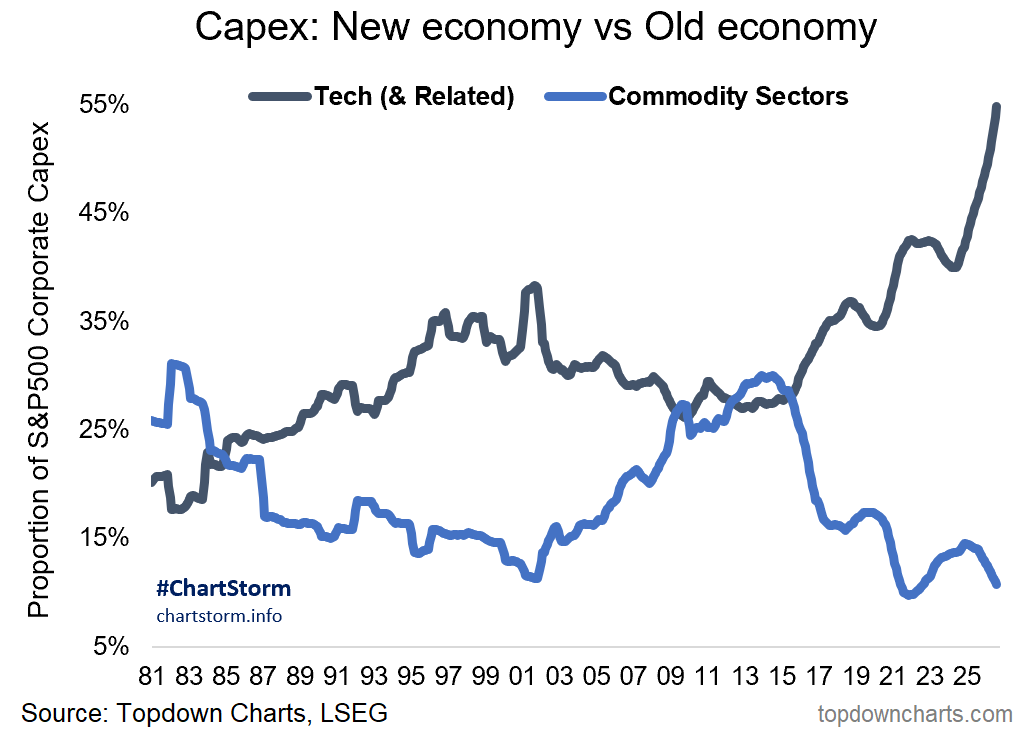
8. Capex Crowd-out — Tech vs Commodities: meanwhile on the topic of capex, the big crowd-out continues. Tech continues to take up an ever larger share of all S&P500 company capex, meanwhile investment in resources continues to plumb the lows. This will be fine if we all just virtualize and upload into the cloud, but I don’t think that is a realistic expectation. We’re still going to need resources, and maybe more so than datacenters as multiple big thematic trends playout — don’t count out the real world yet!
 |
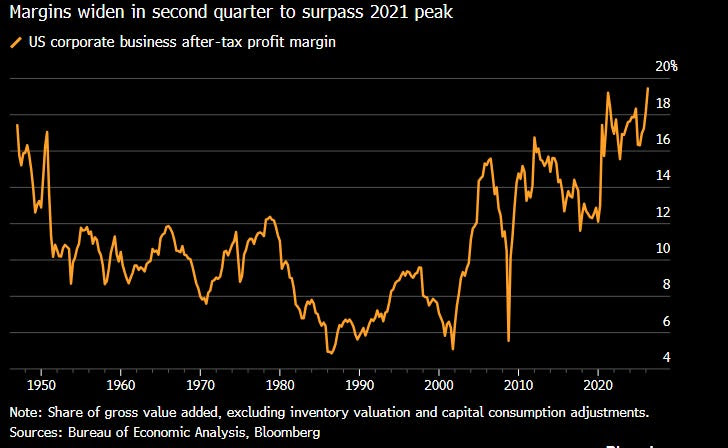
9. Record High Profit Margins: speaking of extremes and record highs, US corporate profit margins reached an all-time high this year.
 |
Source: @Marcomadness2
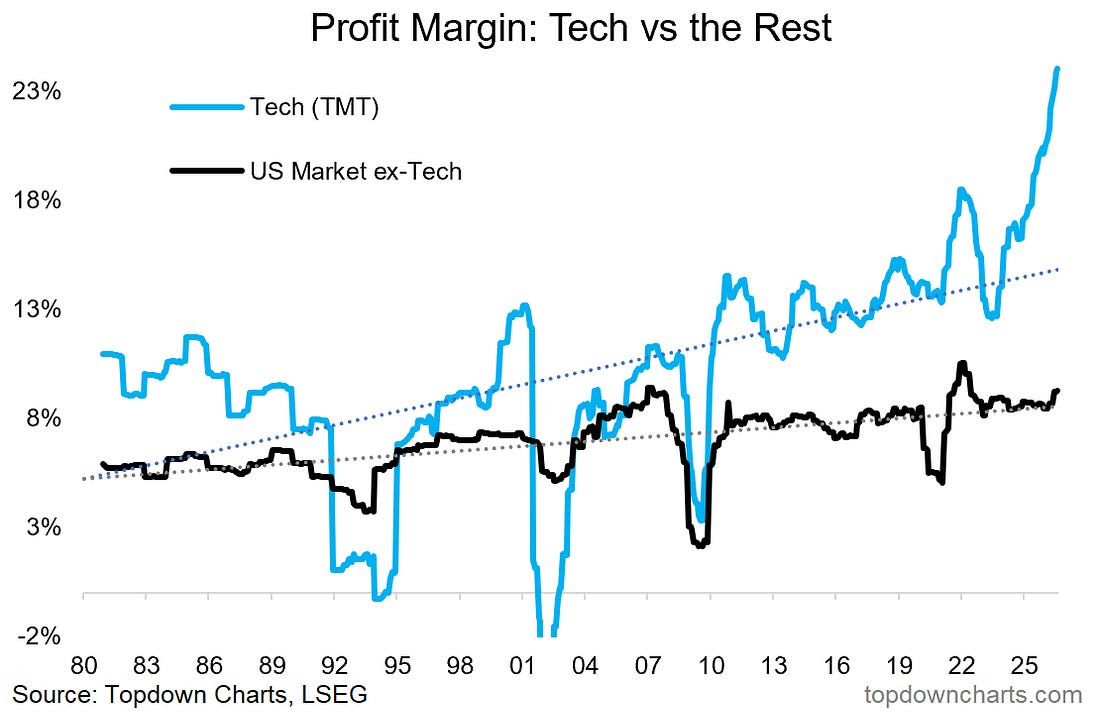
10. Profit Margins — Tech vs Tech-not: looking at listed companies, the big driver to the upside is tech. Non-tech is starting to turn up (more on that in a second), but by contrast tech profit margins stand out as being at a structural + cyclical high… and raise some questions about sustainability. Afterall, the boom-bust cycle will eventually do what it does, and looking back across time, profit margins are a very cyclical thing.
 |
Source: Topdown Charts Professional

Comments
Log in or sign up to join the conversation.