
EUR/USD (1.086): The single currency has posted a steady decline over the past few days breaking below the 1.11 support. Further declines could see the Euro fall to 1.081 - 1.075 level, where the next support is established. Below 1.075, EUR/USD could be looking to test the previous lows established near 1.056 region. However, in the near term, following the break of the trend line, EUR/USD could look for a bounce back to retest the broken trend line near 1.095 - 1.10 handle. Establishing resistance on the pullback could pave the way for further downside, to as low as 1.056 levels. The Stochastics on the daily chart is strongly in the oversold level, highlighting the risk of a short-term bounce in prices.
(Click on image to enlarge)

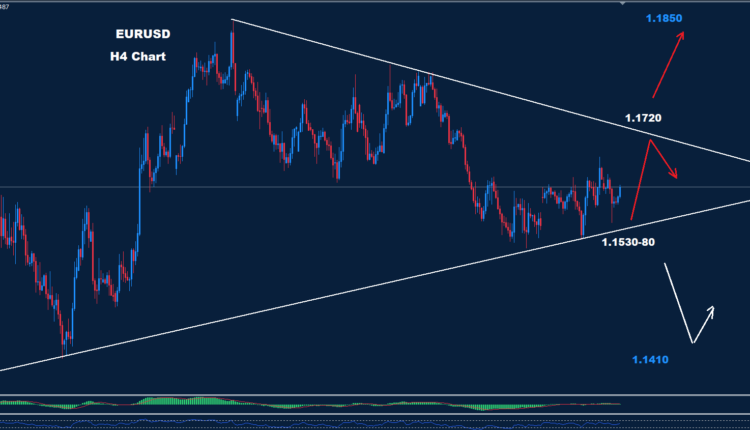
EUR/USD Nearing support at 1.081 – 1.075
- Bias (D1): Down
- Support: 1.081 - 1.075
- Resistance: 1.095 - 1.10
- Technical Forecast: If the bounces are capped near 1.10, EUR/USD could risk breaking the support at 1.081 - 1.075 for a move lower to 1.056. Alternatively a break above 1.10 and establishing support could see a test to 1.11.
USD/JPY (113.2): USD/JPY remains consolidated above the 112.5 - 112 support with two tests below this level to 111.5 - 111.0 being strongly rejected. An eventual move to 117.0 remains in place but we expect to see a short-term dip to see prices close near the 111.5 - 111.0 support. In the near term, the downside risks for USD/JPY looks to be easing, but the overall bias remains to the downside, with a rally to 117 indicating a pullback to the longer term downtrend. The Stochastics oscillator is has printed a higher low on the lower low in prices, indicating bullish divergence and validating the anticipated move to 117.0.
(Click on image to enlarge)

USD/JPY looks to aim for 117 resistance
- Bias (D1): Up
- Support: 111.5 - 111.0
- Resistance: 117.0 - 117.5
- Technical Forecast: Downside looks limited near 111.0 - 111.5 as a longer-term pullback to 117 - 117.5 will mark a correction to the longer term downtrend.
GBP/USD (1.395): Following the strong declines off 1.4635 resistance, GBP/USD broke below the 1.4 2- 1.41 support level. Price action is currently pointing to a potential descending triangle pattern being formed with the current upside likely to stall near 1.41. Another minor leg lower with a potential higher low above the recent lows of 1.3836 could mark a possible breakout higher. GBP/USD remained biased to the downside and the view will change only on a break above 1.42 resistance. In such a case, GBP/USD could potentially target the older resistance near 1.4631.
(Click on image to enlarge)

GBP/USD – Potential descending triangle pattern in the making
- Bias (D1): Correction
- Support: 1.3836 - 1.385
- Resistance: 1.42 - 1.41
- Technical Forecast: Expect GBP/USD to consolidate into a descending triangle which could point to a breakout to the upside to 1.41 - 1.42. Only a close above 1.42 will indicate a move to 1.4635
USD/CAD (1.351): USD/CAD remains in the steady downtrend but is nearing support at 1.346 - 1.3387. The support level is likely to hold on the initial contact as this would mark the first test of support to a previously broken resistance level. The minor median line shows a possible move higher if the support holds. Minor resistance is at 1.3670 - 1.364 and USD/CAD could stay flat within these levels. Above 1.367, a test to the previously broken support level near 1.414 could be tested for resistance, marking a pullback to the declines. Below 1.3387 support, 1.3136 comes in as the next support level. The Stochastics oscillator is currently oversold adding to the view that a test to the 1.346 - 1.3387 support could hold the declines.
(Click on image to enlarge)

USD/CAD nearing 1.346 – 1.364 support
- Bias (D1): Down
- Support: 1.346 - 1.3387
- Resistance: 1.367 - 1.364
- Technical Forecast: 1.346 - 1.3387 support could see USD/CAD test the minor resistance. USD/CAD could stay flat with the potential to break out from the support or resistance levels. 1.414 resistance to the upside and 1.3136 is the support to the downside on a breakout
USD/CHF (0.99): USD/CHF is nearing the identified breakout level from the earlier median line near 1.0045. Prices are trading near the outer median line plotted and a reversal here could see a dip to 0.9928 - 0.9848 support. If this key support breaks, USD/CHF could be looking at steeper declines for a test to 0.954. Alternately, a breakout from the outer median line could see a test of resistance near 0.9928 and potentially test the upper resistance near 1.015. The Stochastics oscillator is in the overbought level currently, indicating USD/CHF could potentially decline to test the support at 0.9928.
(Click on image to enlarge)

USD/CHF likely to stay range bound for now
- Bias (D1): Flat
- Support: 0.9928 - 0.9848
- Resistance: 1.015 - 1.0045
- Technical Forecast: USD/CHF could remain range bound within the specified support and resistance levels. 0.9928 - 0.9848 support will be critical in holding further declines.
Comments
Log in or sign up to join the conversation.