


US 500 (S&P 500) keeps on giving
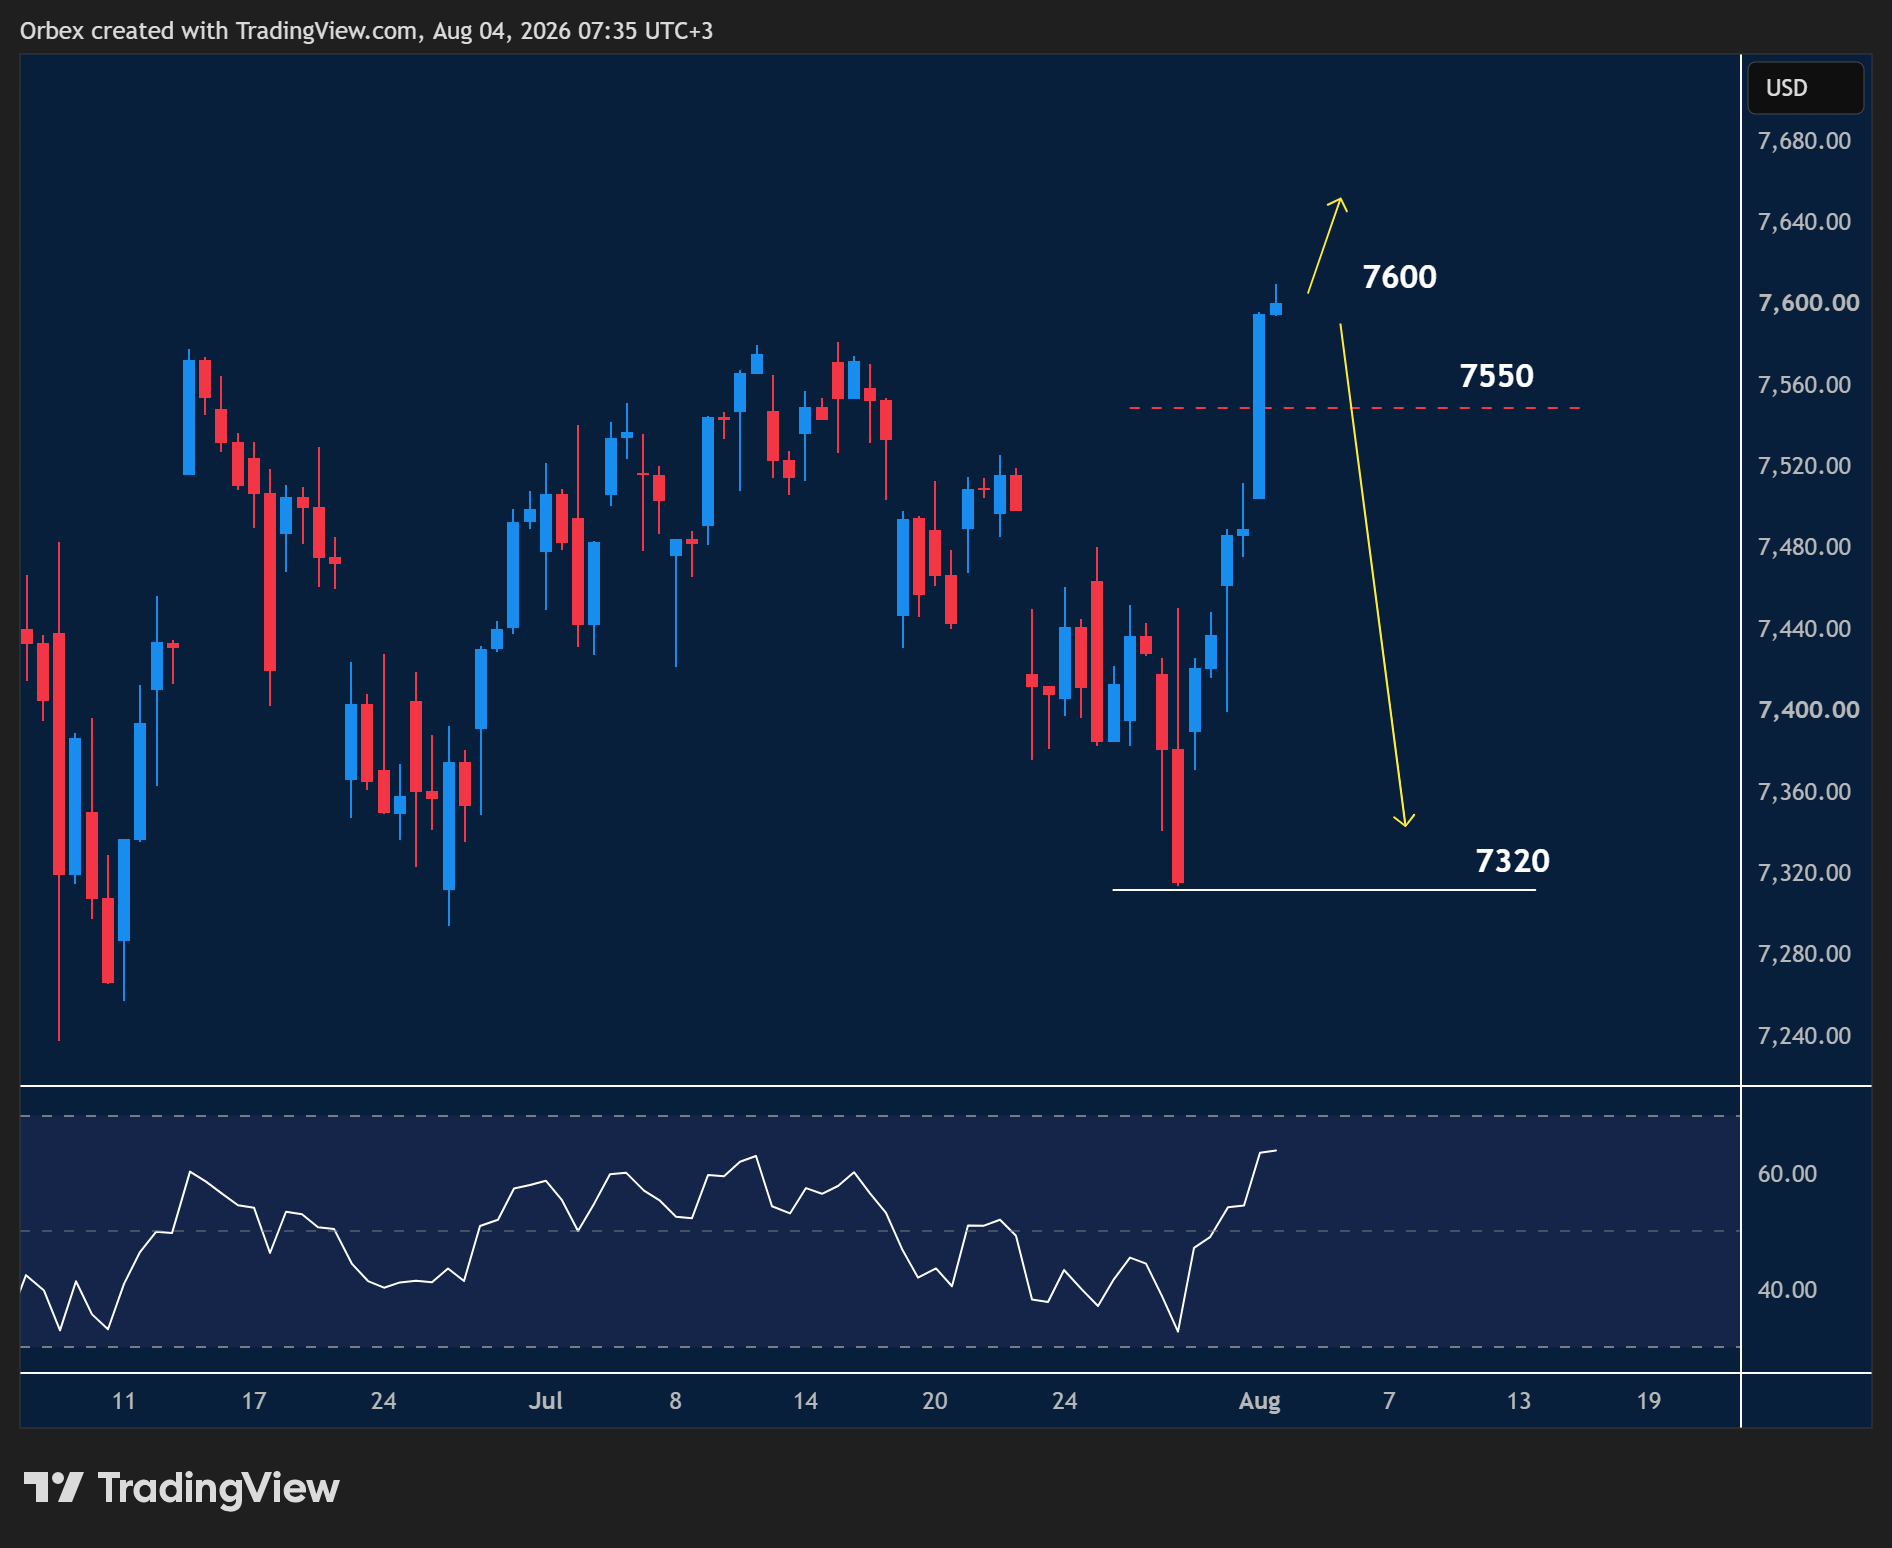
The US 500 (S&P 500) pushes even higher as stocks continue to rise, with oil prices pressured.
A close above 7550 supported the bullish trajectory, with no signs of exhaustion.
A retracement could begin if short-term buyers take profit, as the RSI shows a clear bearish divergence.
The fallback could be seen as an opportunity as medium-term rally players step in.
7440 is an important support if sellers step in, with 7320 at the base of the rally being a critical support.
NZDUSD breaks lower
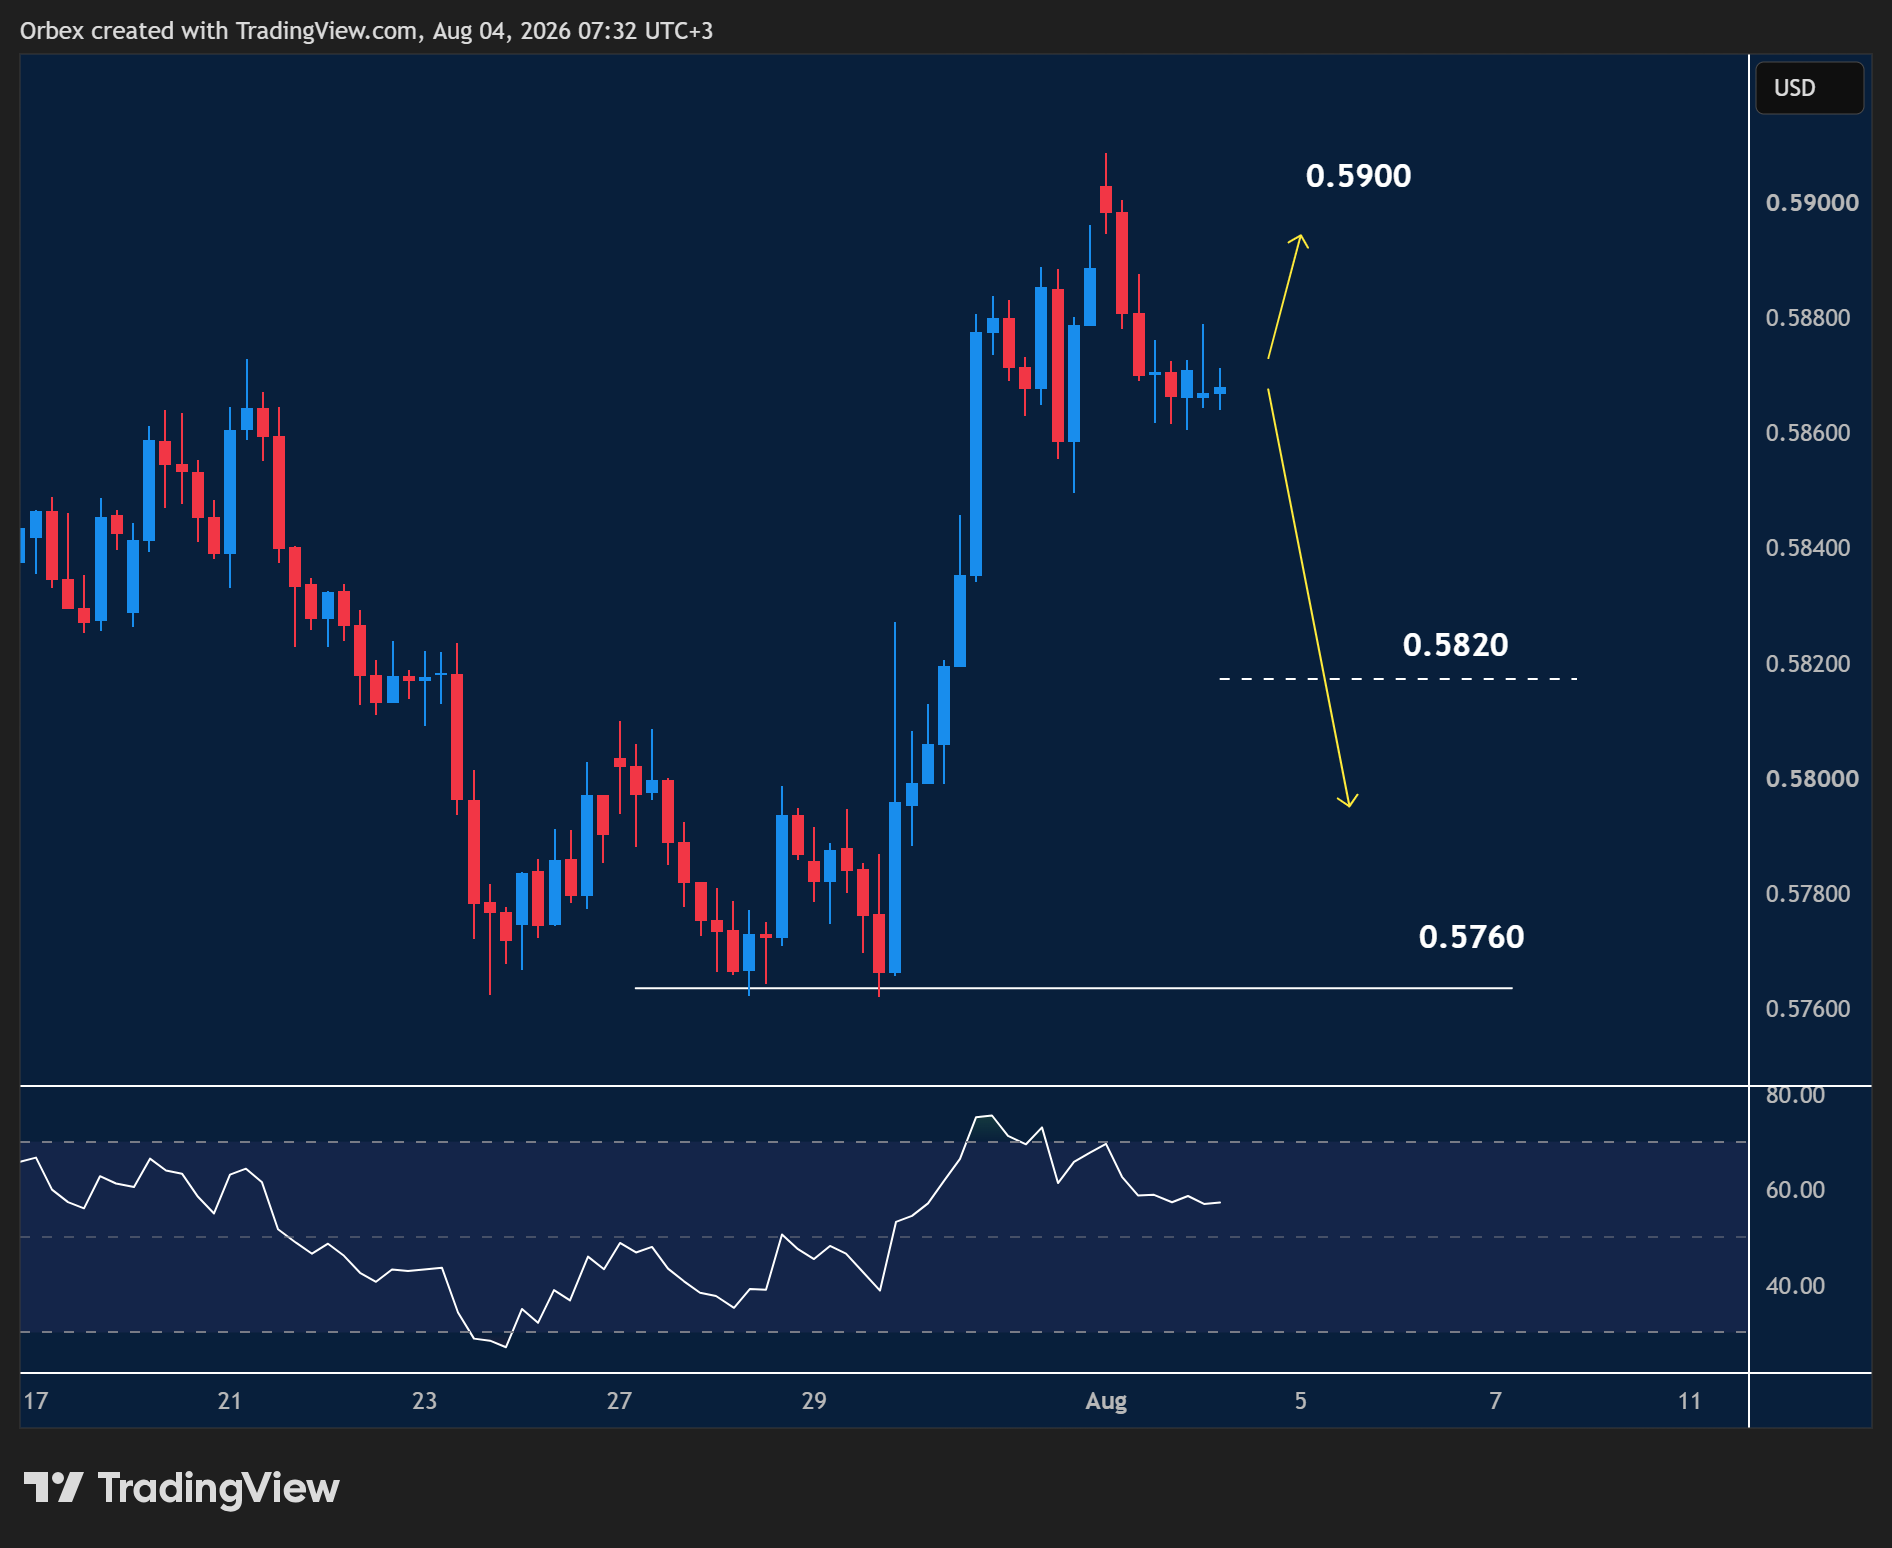
The US dollar regains some composure as the Kiwi rally dies down.
A move away from the psychological level of 0.5900 has prompted some buyers to trim their exposure.
0.5820 is the next obstacle for sellers to break, potentially opening the door to 0.5760.
Instead, a consolidation phase could prompt buyers to reenter the market to test the recent high just above 0.5900.
EURGBP tests critical floor
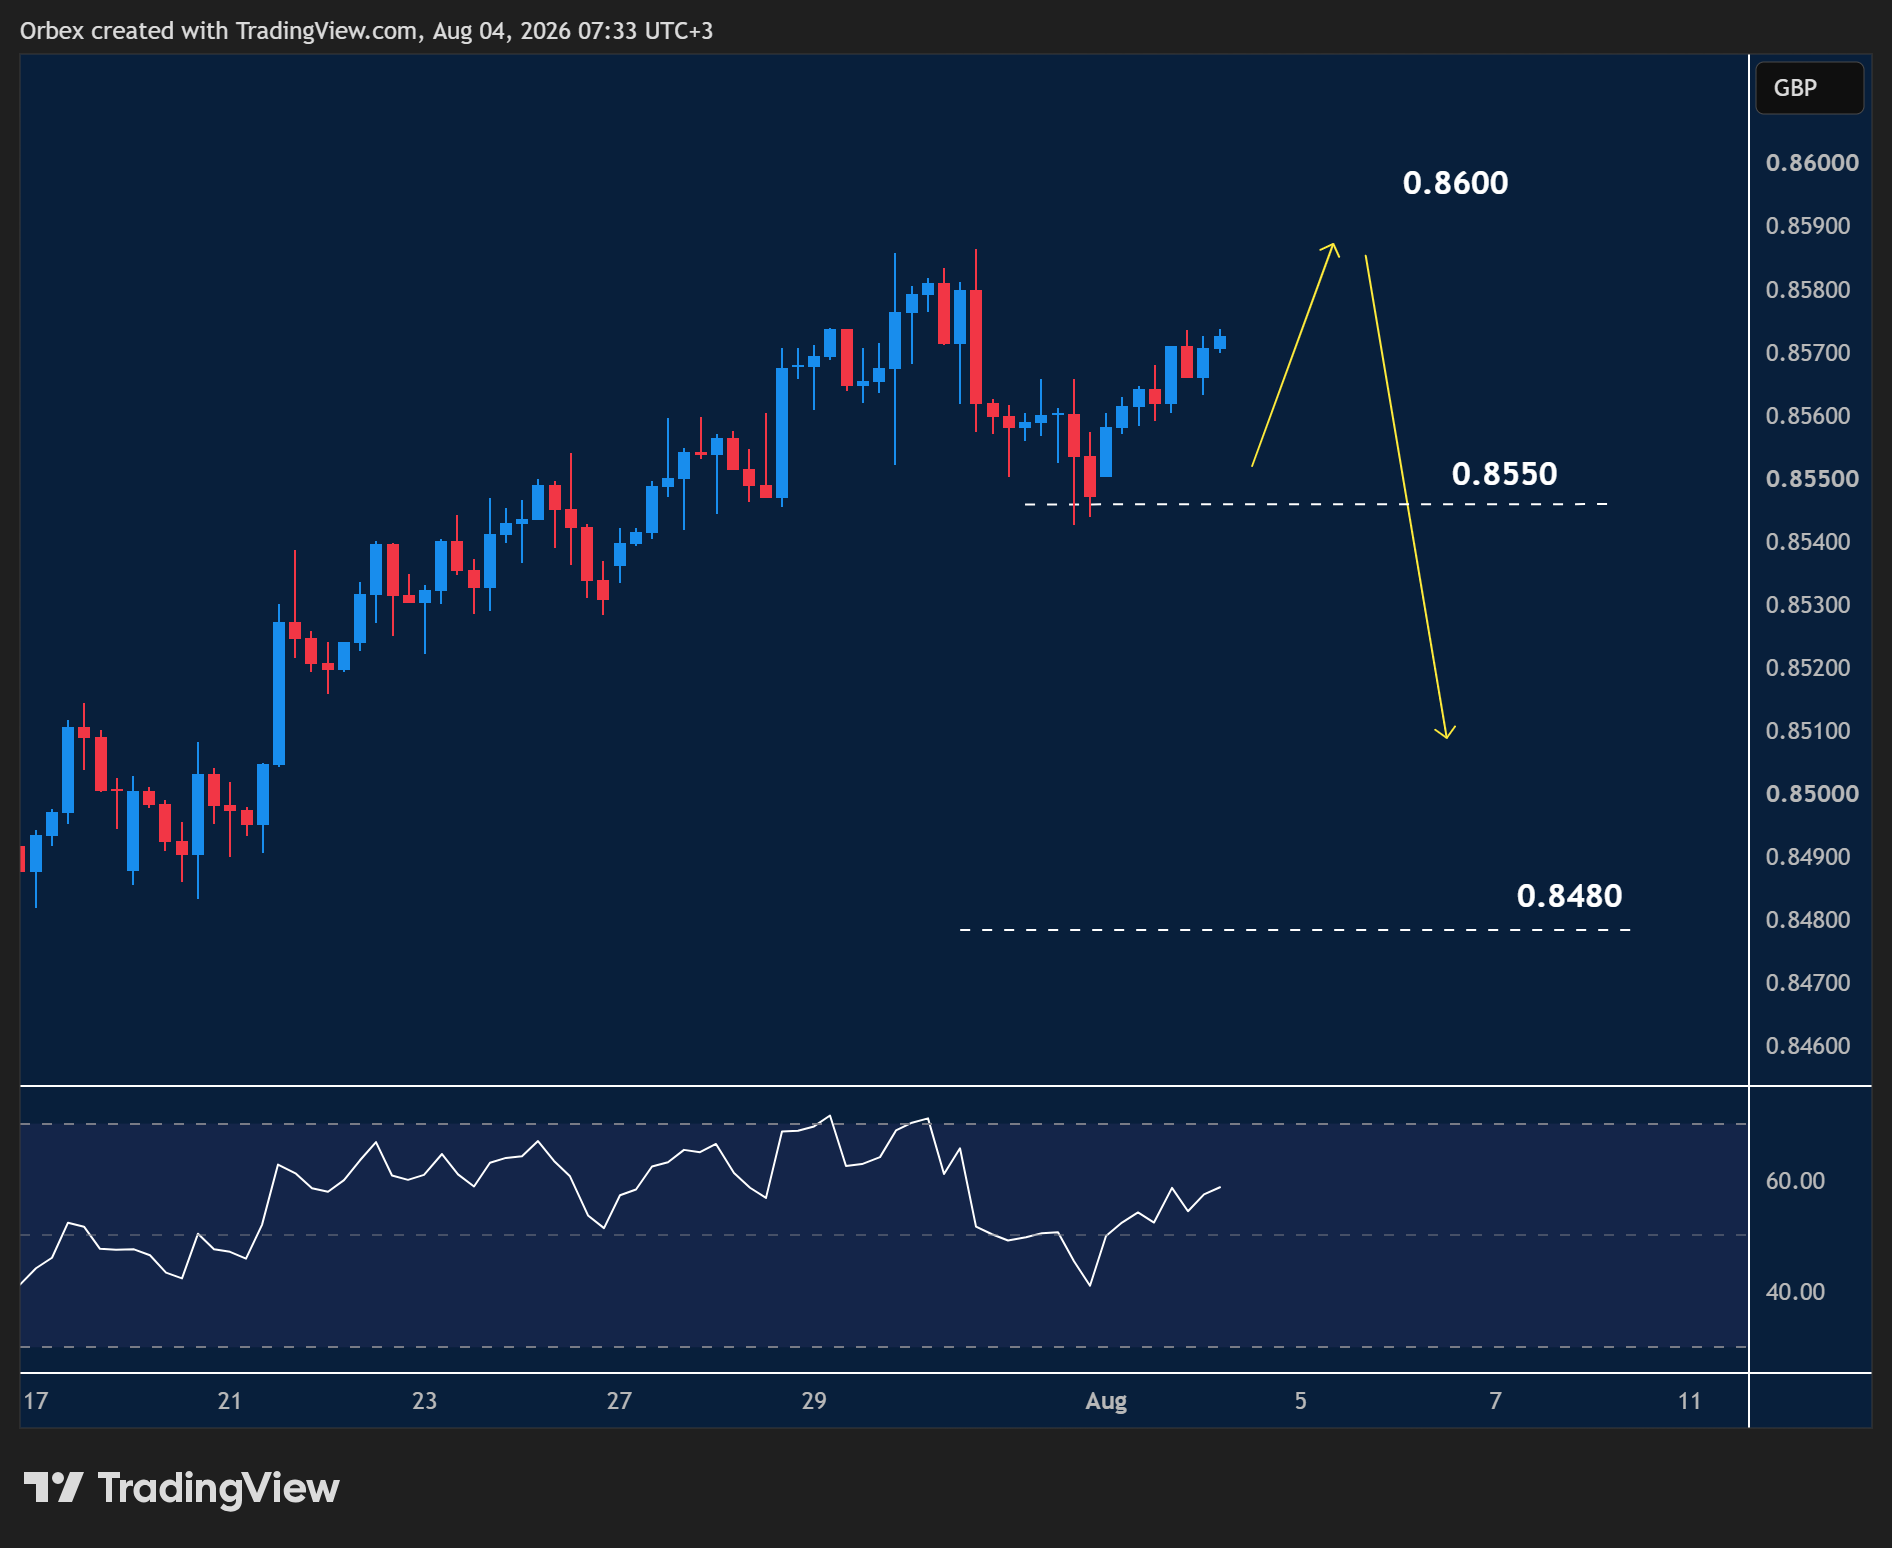
The Euro halted its corrective path as the pair found support to maintain the bull rally.
The sell-off stopped after a bounce at 0.8550 forced sellers to bail out.
A break above 0.8600 is the next target, signalling more strength.
Bulls will need to clear 0.8580 first before they can fully regain control.
Otherwise, a bearish breakout would extend losses towards 0.8480.



Comments
Log in or sign up to join the conversation.