


Image Source: Unsplash
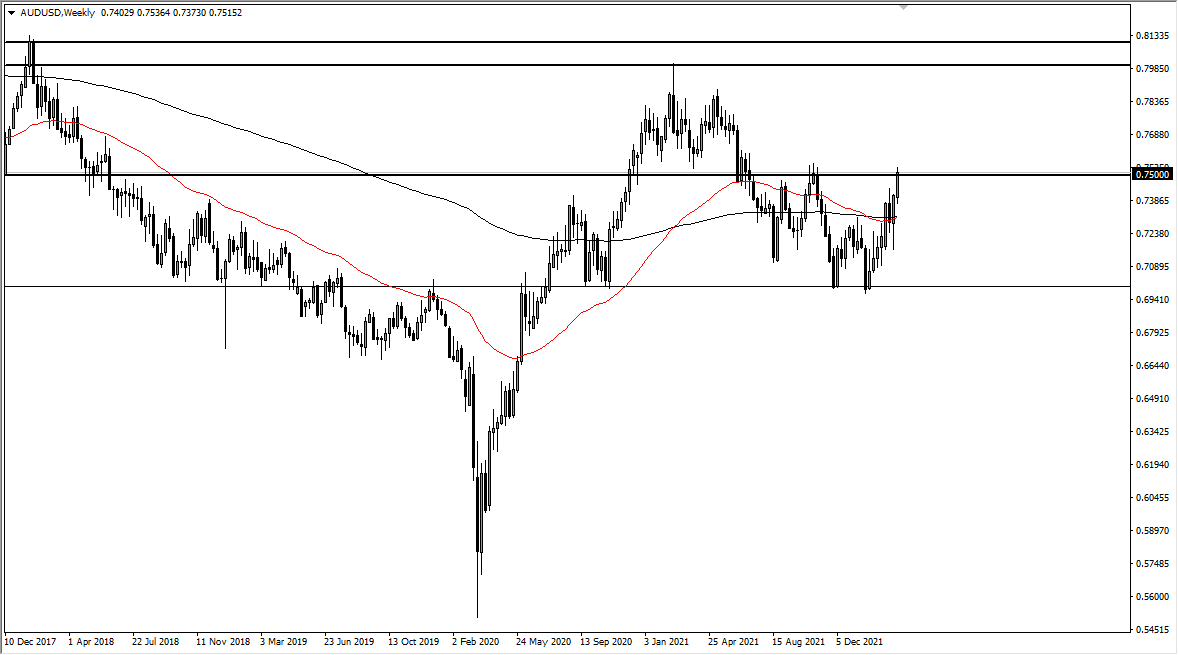
AUD/USD
The Australian dollar rallied significantly last week to reach the 0.75 level. This is an area that has been very difficult for markets to overcome for quite some time, so it should not be a huge surprise that we have stopped right there. The question now is whether or not we can continue to go higher? If we do break the 0.76 handle, at that point the Australian dollar would become “buy-and-hold.”
Otherwise, it is very likely we could pull back towards the 0.74 handle, an area that has been important on short-term charts. This could offer enough support to cause this market to try to smash through this very difficult resistance zone.
EUR/USD
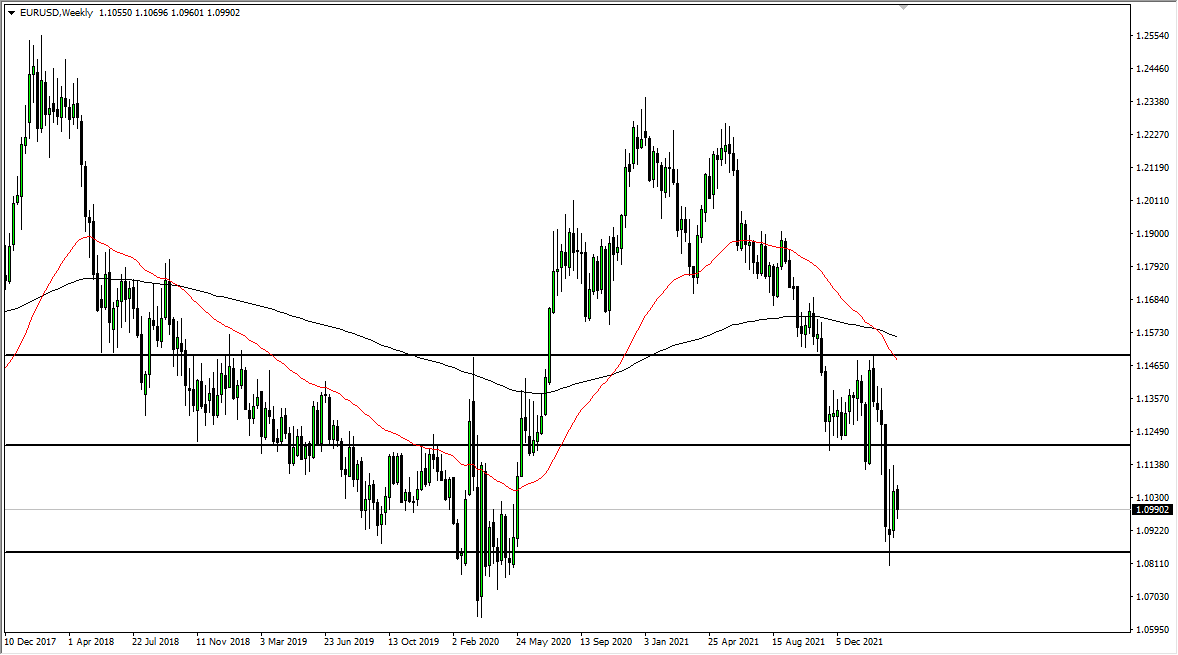
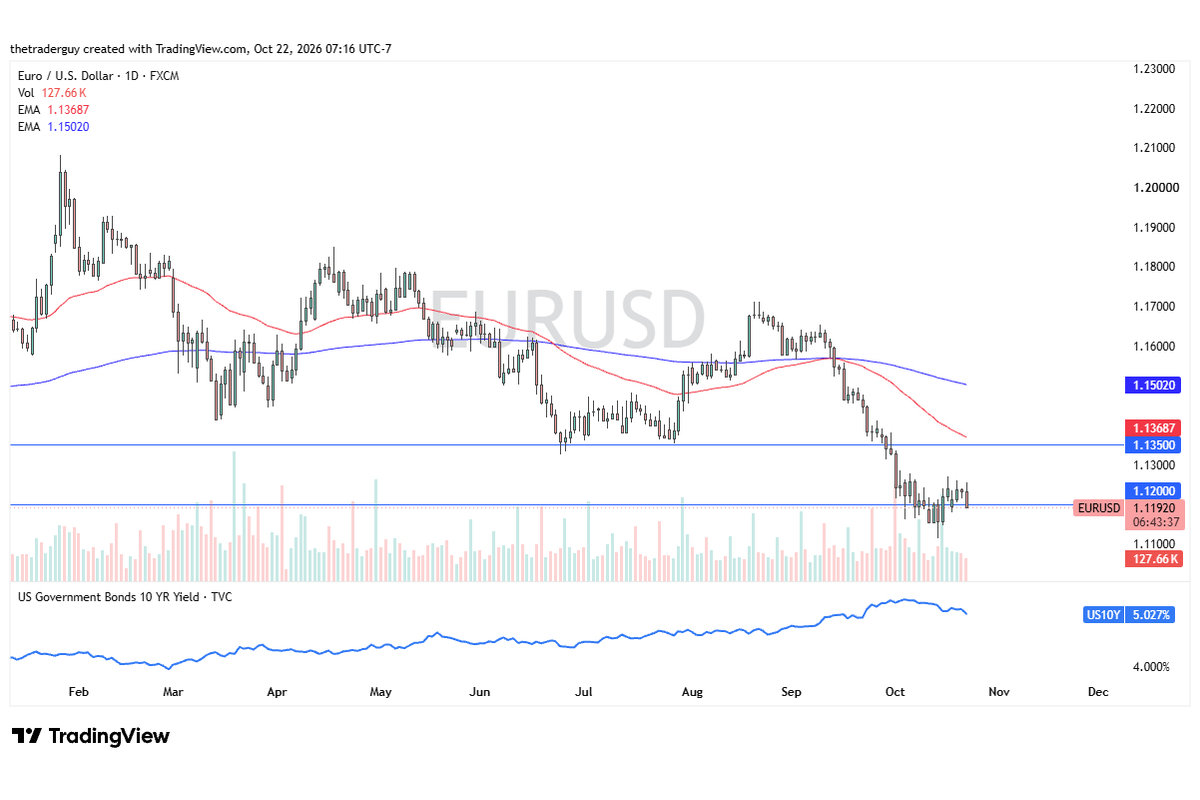
The euro fell a bit last week as we continued to see the downtrend play out. Ultimately, this is a market that I think will drag down towards the 1.0850 level. It continues to be very choppy but with more of a downward slant than anything else.
I think it is not until we break above the 1.12 level that we can take any rally seriously. Until then, I will be fading short-term rallies and looking for short-term gains.
NZD/JPY
The New Zealand dollar continued to rally rather significantly, especially against the Japanese yen. The Japanese yen has been crushed against almost everything on the planet, and it looks as if the New Zealand dollar has been trying to clear the ¥85 level.
Breaking above there would open up the possibility of a runaway market. That being said, I would not be surprised at all to see a little bit of a short-term pullback in order to build up momentum. The ¥82 level is the previous high that should now offer a little bit of support.
GBP/USD
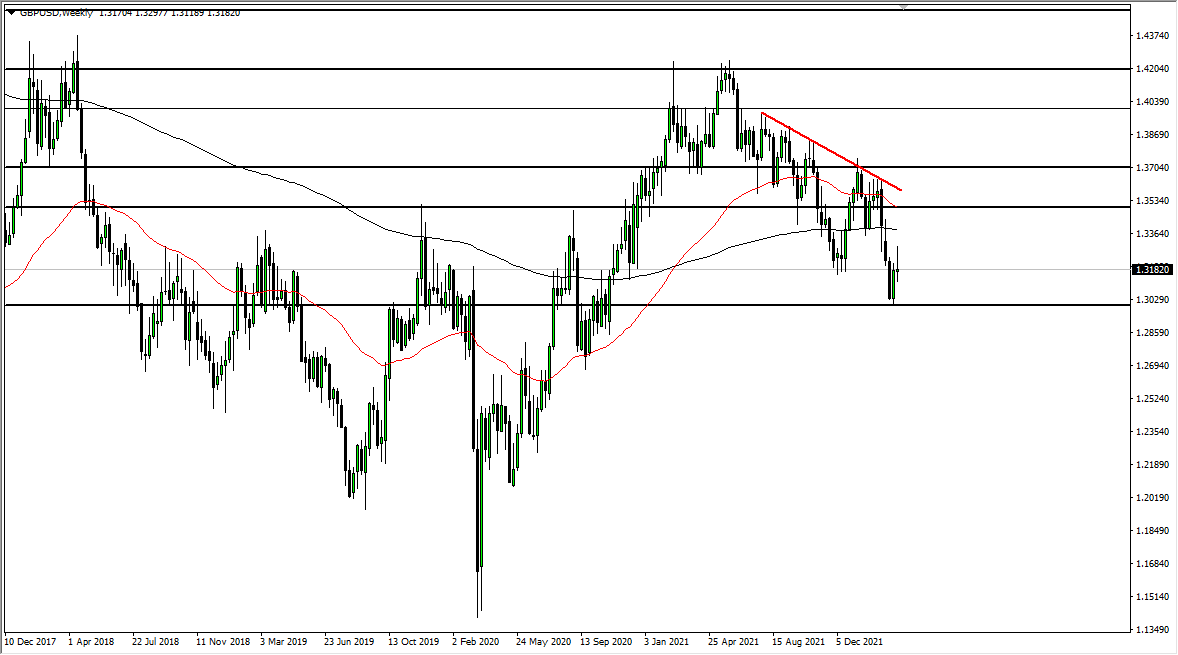
The British pound shot higher last week, but as you can see, it has also given back quite a bit of the gain. This is not a good look, and it does suggest that we are probably going to drop towards the 1.30 level underneath.
That is a large, round, psychologically significant figure, and if we break down below there, it is likely that we could go towards the 1.28 handle. If we were to break above the top of the weekly candlestick, we could go looking towards the 1.34 handle.
Comments
Log in or sign up to join the conversation.