


Meta Q3 earnings preview
Meta is due to report Q3 earnings on Wednesday, October 21, with the market looking for signs that its huge investments in AI are bringing a return to its advertising business rather than simply adding to costs.
Expectations are for revenue to rise 23% to $63.3 billion, but for EPS to decline 15.7% to $6.11 a share.
In the previous quarter, Meta reported revenue growth of 28% to $60.8 billion. However, operating income fell 8% and net income declined 14% amid surging expenses. The share price came under pressure following these results, highlighting the market's concerns over the costs of its AI ambitions. However, the share price has since recovered following the success of the Muse AI app.
Investors will be looking for evidence that AI is generating returns through advertising, which could help justify escalating infrastructure spending.
Capital expenditure is projected to rise sharply, with investors focused on the company's full-year guidance of $130 billion to $145 billion. Looking ahead, the market will be watching to see whether Meta maintains this range or signals further increases. The concern is that spending could continue to rise before the benefits of AI become clear in its financial results.
Advertising is Meta's core business and its biggest growth driver, with advertising revenue expected to rise 24% to $62.2 billion.
Daily average users grew 3% year on year in Q2 to 3.6 billion. The idea is that AI could help drive higher advertising spend through more effective targeting, better measurement and improved campaign performance.
An improved conversion rate, owing to more targeted advertising, could make advertisers more willing to spend, creating a more direct link between AI investment and higher revenue.
Meta's Muse AI assistant has also gained traction, reaching 5 million downloads faster than ChatGPT and Claude. This adds to the potential for AI to become a meaningful growth driver, although downloads alone do not demonstrate how much revenue the product will generate.
However, this comes at a cost. Despite the advertising business generating strong revenue growth, AI infrastructure spending is consuming much of that cash. Investors will want to see whether the returns from AI can eventually justify the scale of the investment.
How to trade META earnings
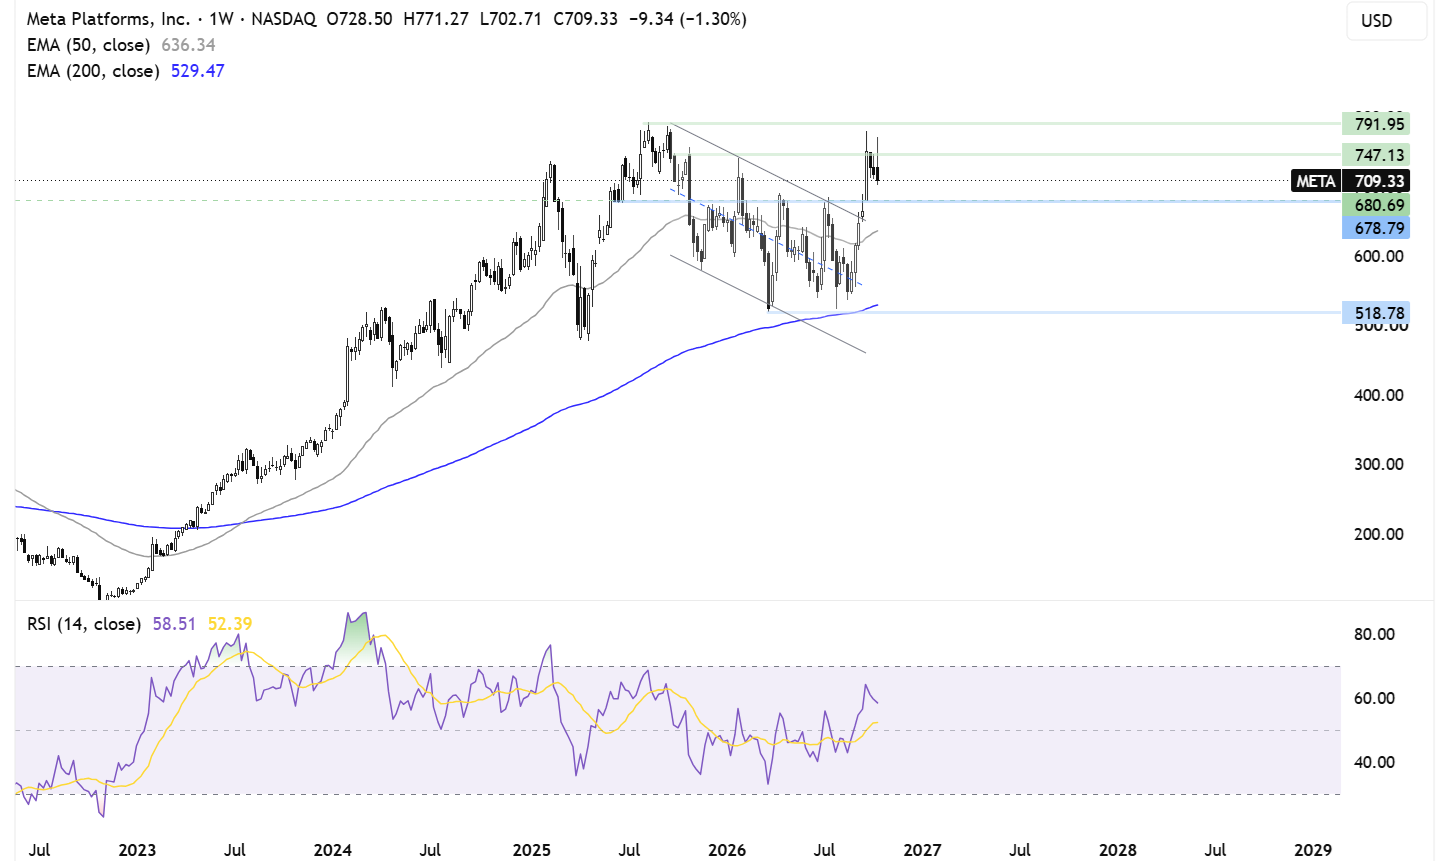
On the weekly chart, Meta broke out of the descending channel, rising towards $780 before easing lower to current levels around $715. The long upper wicks on recent candles suggest that buying demand at higher levels has been weaker, raising the possibility of a reversal.
On the downside, support can be seen around $680, with a break below here exposing the 50-week moving average at $636.
Buyers will look to push back above $750 to bring $790 and fresh record highs into focus. A sustained break above this area would strengthen the bullish outlook, while a failure to recover could leave the stock vulnerable to a deeper pullback.
Tesla Q3 earnings preview
Tesla is due to report Q3 earnings after the market close on October 21. Expectations are for earnings to fall 15% to $0.43 a share compared with the same period last year, while revenue is expected to decline 0.8% annually to $27.9 billion.
Capital expenditure is expected to rise sharply to $7.5 billion, up from $2.3 billion a year earlier. For Q4, EPS is expected to decline 7.8% to $0.46, while revenue is forecast to rise 14.4% to $28.5 billion. Capital expenditure is also expected to continue rising towards $9 billion in the final quarter of the year.
Deliveries for the quarter totalled 486,532, down 2.1% year on year. While deliveries exceeded expectations, they were still lower than a year earlier, leaving room for a positive earnings reaction if margins and forward guidance are better than expected. However, it also leaves room for disappointment if costs continue to rise.
With this in mind, gross margins will be a key area of focus, particularly the impact of discounts, incentives and raw material costs. Tesla has been using pricing incentives to support demand, particularly in China. If volumes hold up but margins deteriorate, investors might question the quality of that growth.
Attention will also be on whether Tesla can sustain demand without further discounting. With fuel prices in the U.S. rising, electric cars could become more attractive to consumers. However, high interest rates and expensive vehicle financing are increasing monthly payments, which could push buyers towards cheaper models or cause them to delay purchases.
Chinese competition is another focus, particularly BYD, which continues to put pressure on EV prices. Tesla's Shanghai-built vehicle sales rose in Q3, but discounting remains a concern for margins.
The longer-term valuation story centres on robotics and autonomous driving. The market will be keen to hear about concrete progress on robotaxi deployment, regulatory approval and autonomous driving capabilities, as well as the rollout of the Optimus humanoid robot. Investors will be looking for milestones that point to future revenue rather than just ambitious timelines.
How to trade TSLA earnings
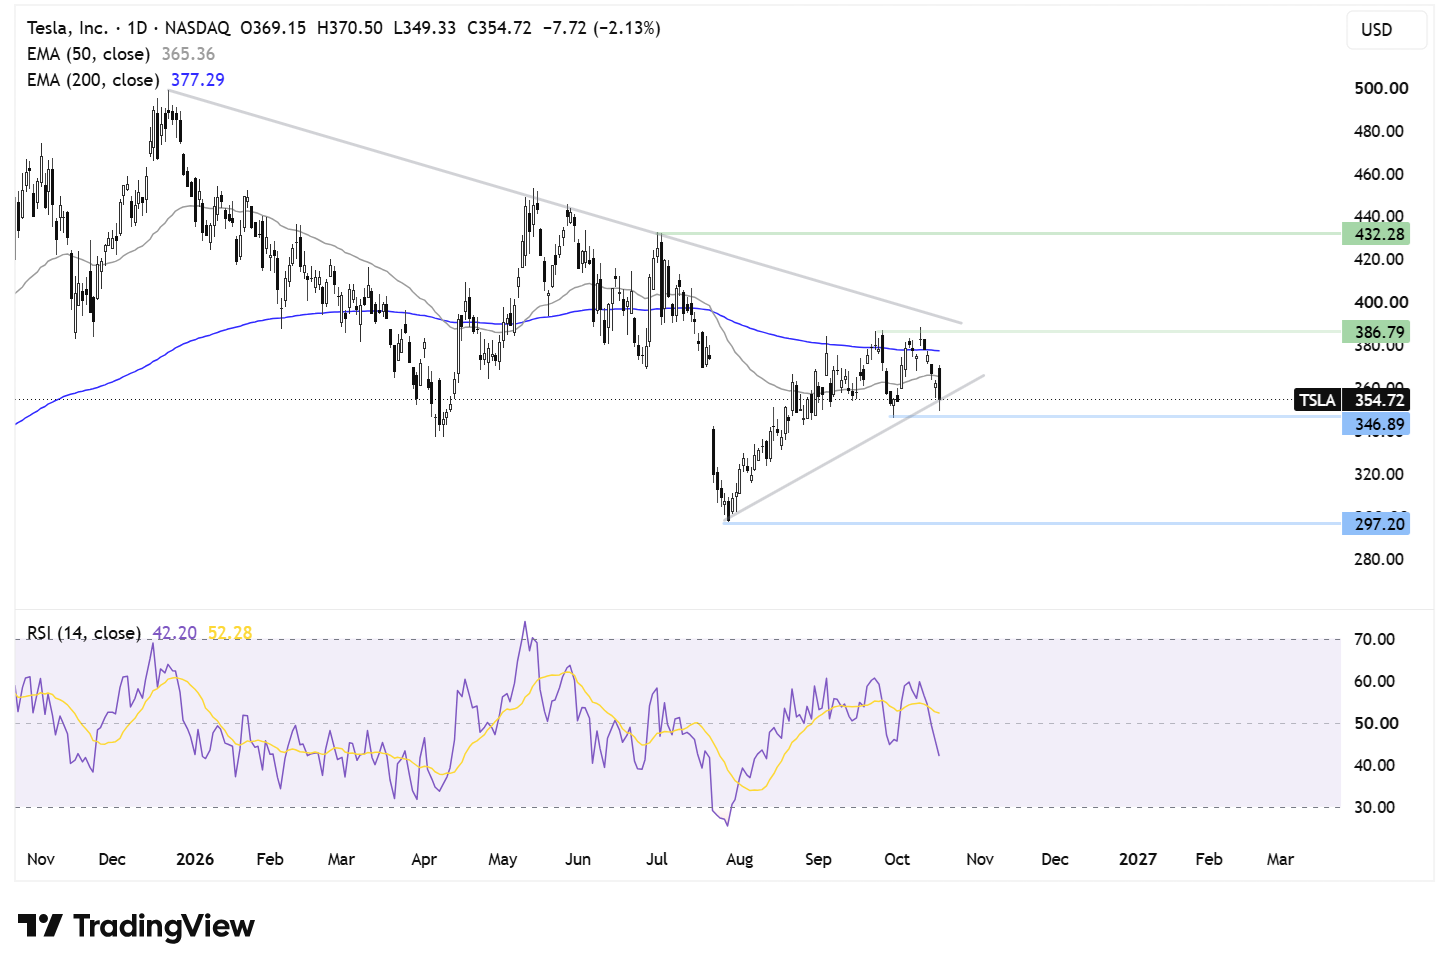
Tesla has been trending lower since December 2025 and now trades below its falling trendline, as well as its 50 and 200 EMAs. The price is testing rising trendline support around $355.
With the RSI below 50, momentum favours sellers. A confirmed break below $345 would open the door to $300, the 2026 low, and would strengthen the bearish outlook.
Any recovery would need to reclaim the 50 EMA at $365 and the 200 EMA at $378 before testing resistance at $390, where the falling trendline and October high come into focus.
A rise above this area would improve the technical picture and bring $430, the July peak, into focus. However, the price would need to break through these resistance levels before the broader outlook becomes more constructive.
Netflix Q3 earnings preview
Netflix will report Q3 earnings on October 20 after the market close, with investors looking for evidence that its advertising business and content pipeline can sustain growth.
Management guided for Q3 revenue of $12.86 billion and diluted EPS of $0.82 a share, below market expectations at the time. This sent the share price lower following the announcement.
As a result, investors will be looking to the results for reassurance that the business is still growing at an attractive pace.
In Q2, Netflix posted revenue of $12.56 billion, marking a 13% year-on-year increase, while diluted EPS came in at $0.80.
Revenue this quarter is expected to extend its double-digit expansion. However, Netflix is no longer just a subscription story, with around 325 million paying members. Management is increasingly focusing on revenue and operating profit as key measures of progress and stopped reporting subscriber numbers quarterly last year.
The ad-supported subscription tier is central to its growth plans, giving the firm an additional source of income from viewers while opening up a larger advertising opportunity.
Advertising revenue is forecast to reach $3 billion this year, although growth has been slower than initially expected, with Q2 advertising revenue coming in below expectations. Investors will want to see evidence that Netflix is attracting advertisers and converting that demand into revenue. Advertising revenue is expected to rise to around $806 million in Q3, up 22% from a year ago.
If advertising takes longer to scale than expected, growth could disappoint and put further pressure on the share price. The key question is whether advertising can become a meaningful additional revenue stream alongside subscriptions.
Content remains crucial. Engagement is important and Netflix continues to compete with other platforms, including YouTube, Instagram and TikTok, for viewers' time and attention.
A strong content pipeline can help support price increases and keep subscribers engaged. However, weaker content risks higher cancellations, particularly if interest rates remain elevated and disposable incomes come under pressure.
How to trade NFLX earnings
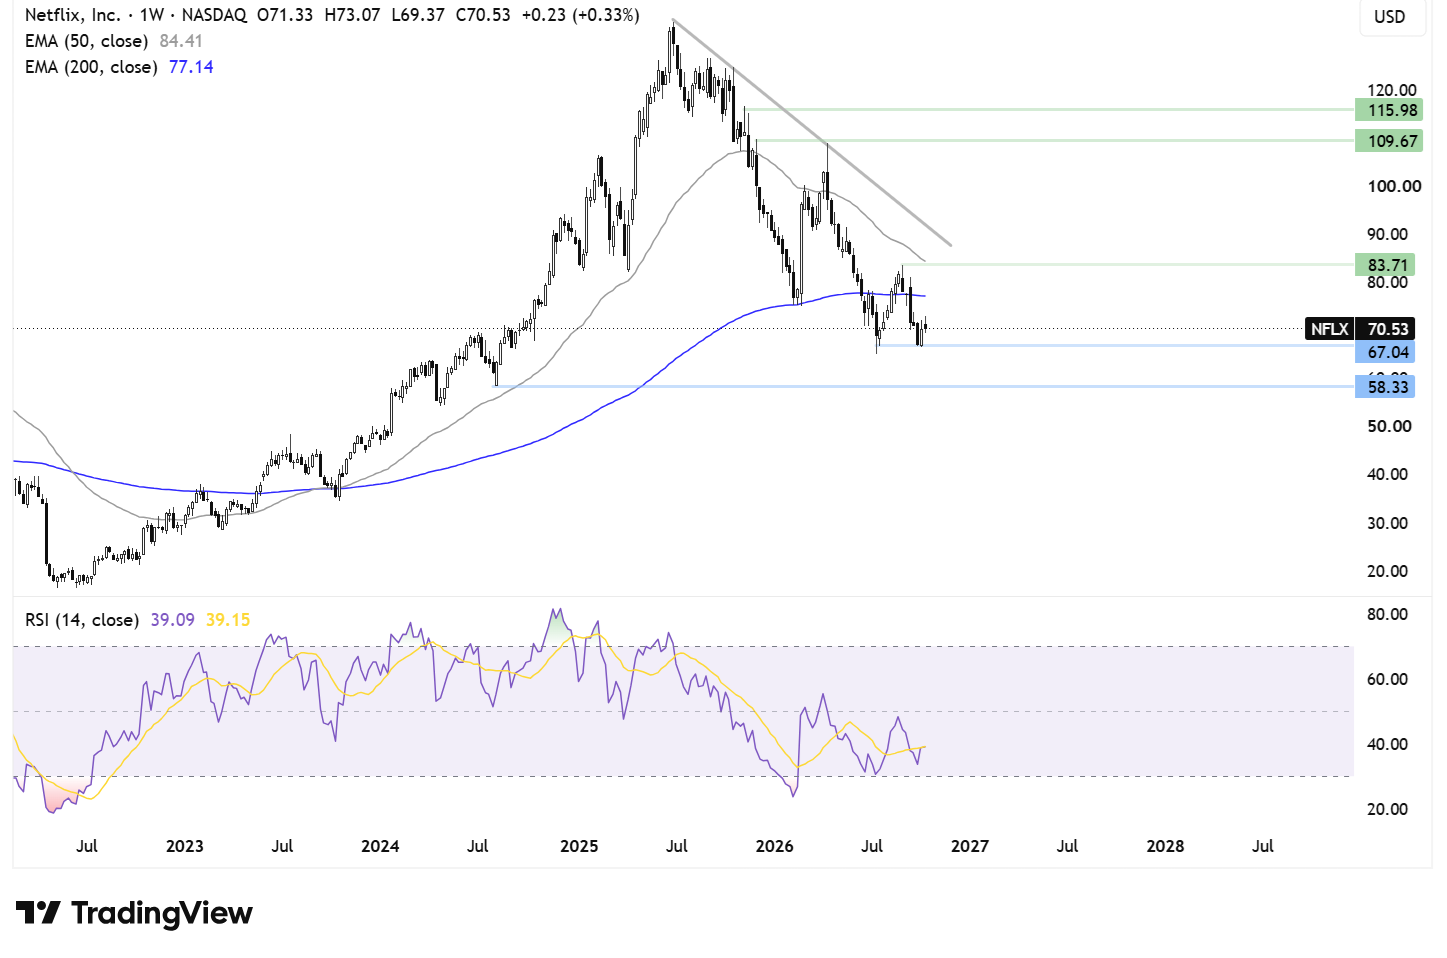
After running into resistance at $134, Netflix has been trending lower, falling below its descending trendline and its 50 and 200 EMAs before finding support around $67, its 2026 low.
The picture remains bearish, with the path of least resistance pointing downwards. Sellers will look to break below $67 to bring $58, the August 2024 low, into focus.
On the upside, buyers would need to reclaim the 200 EMA at $77.30 and rise above resistance around $84, the August high, as well as the 50 EMA. Above here, attention turns to falling trendline resistance at $91.
A break above $91 would improve the technical outlook and bring $110 into focus. Until then, the broader trend remains under pressure, with the $67 support level key to the near-term outlook.



Comments
Log in or sign up to join the conversation.