

In today’s article, we’ll be taking a look at the current Elliott Wave Structure for the world’s largest retailer Walmart (NYSE: WMT).
Since August 2019, WMT rallied within an impulsive 5 waves advance which took the stock to new all time highs before the cycle ends on November at $125.69. Down from there, it started a correcting lower that unfolded in 3 waves move as a Zigzag Structure which reached the equal legs area at $113.7 - $108.6. The blue boxes presented in the chart is a High-frequency area where the instrument is likely to end cycle and make a turn in favor of the main trend which is in the case of Walmart to the upside. Therefore, we are expecting the stock to start another bullish cycle aiming for a break to new all time highs with a target round $134 - $140 area.
Walmart WMT 4H Chart ( Zigzag Structure )
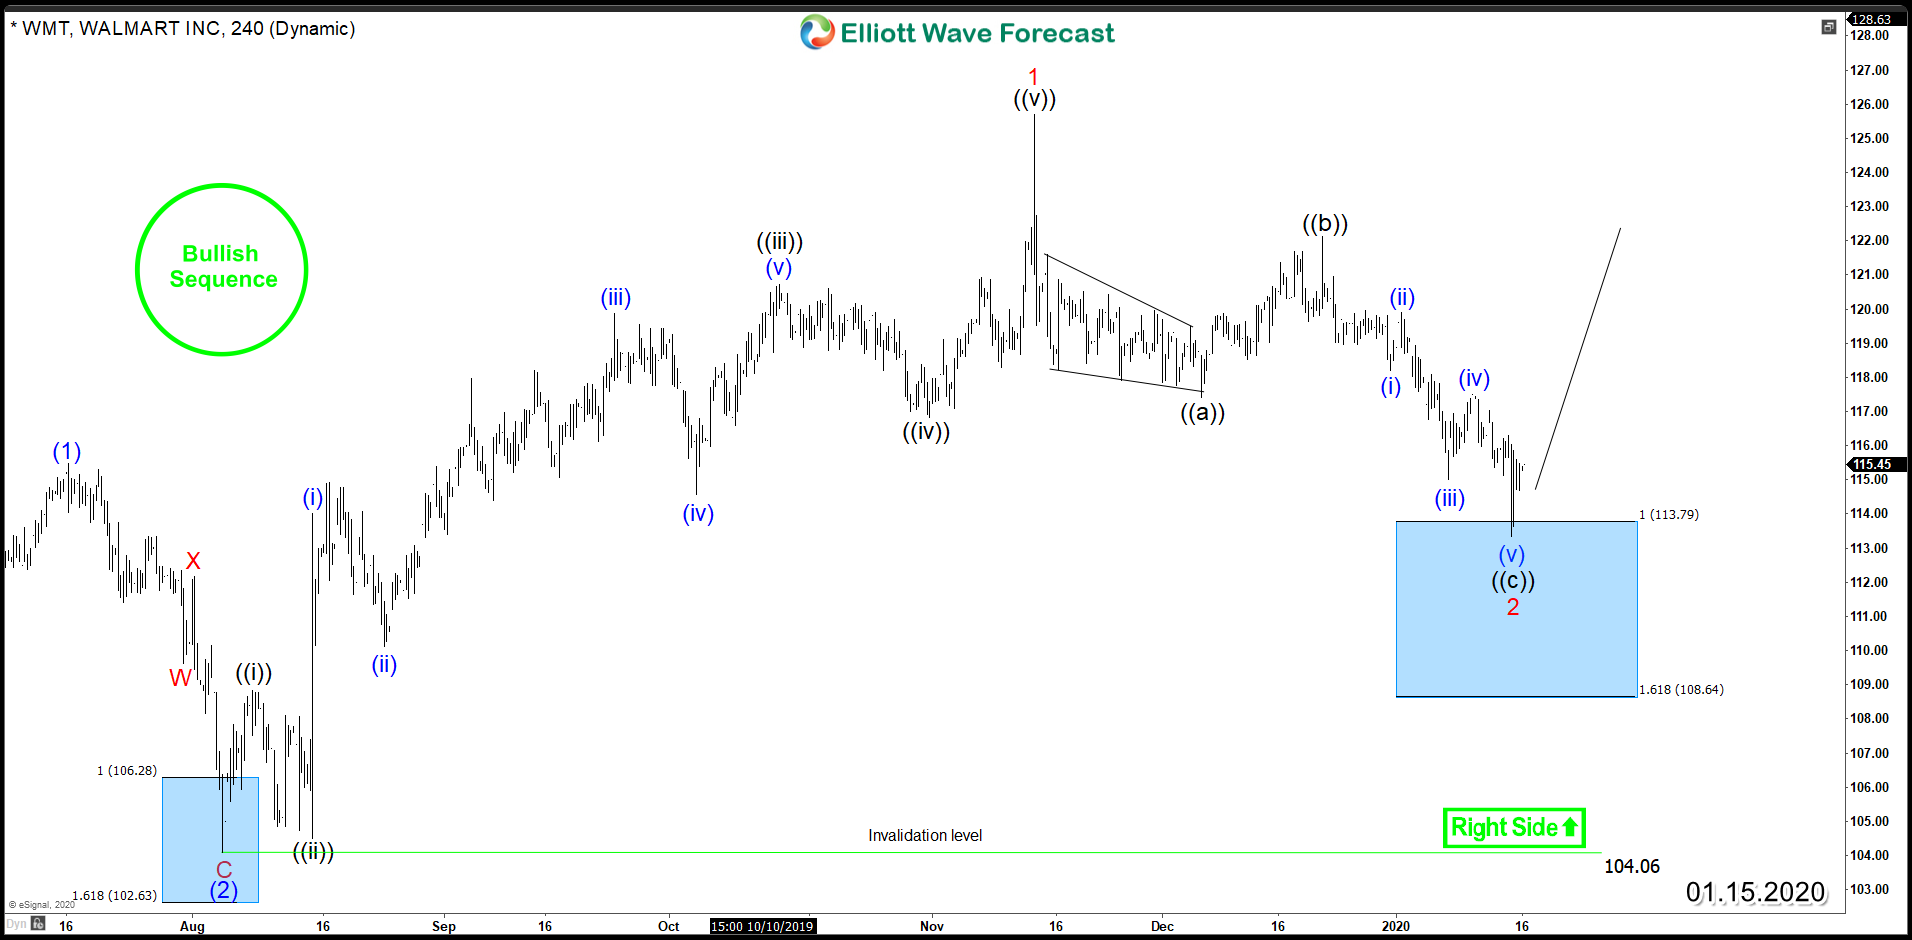
However, if Walmart only bounces in 3 waves from the blue box area and fails to break above November 2019 peak, then the stock will have the possibility of doing a larger correction lower which can unfold as a 7 swings move within a Double Three structure. After ending the correction, the stock is still expected to find buyers again as the main daily cycle from 2015 & 2018 lows remain in progress showing an incomplete sequence. Consequently, the stock should remain bullish and keep finding buyers after 3 , 7 or 11 swing pullbacks.
Walmart WMT 4H Chart ( Double Three Structure )




Comments
Log in or sign up to join the conversation.