

Walmart (NYSE: WMT) is the world’s largest retailer, operating discount stores, supercenters, and grocery stores around the world.
In today's article, we'll take a look at the short term cycle of the stock based on Elliott Wave Theory :
Back in July 2019, WMT made new all-time highs by breaking above January 2018 peak and opened a bullish sequence for the stock from 2015 low supporting a move higher toward target area at equal legs $135 - $168. Since then the stock become more supported in the short term and looking to find buyers in every pullback against $81 low.
The first correction from July peak came in a double three structure which found buyers at the blue box area $106 - $102 before resuming the rally again to new all-time highs. The blue boxes in our charts are a High-frequency area where the Market is likely to end cycles and make a turn.
The rally from August 2019 low can be labeled in 2 different ways :
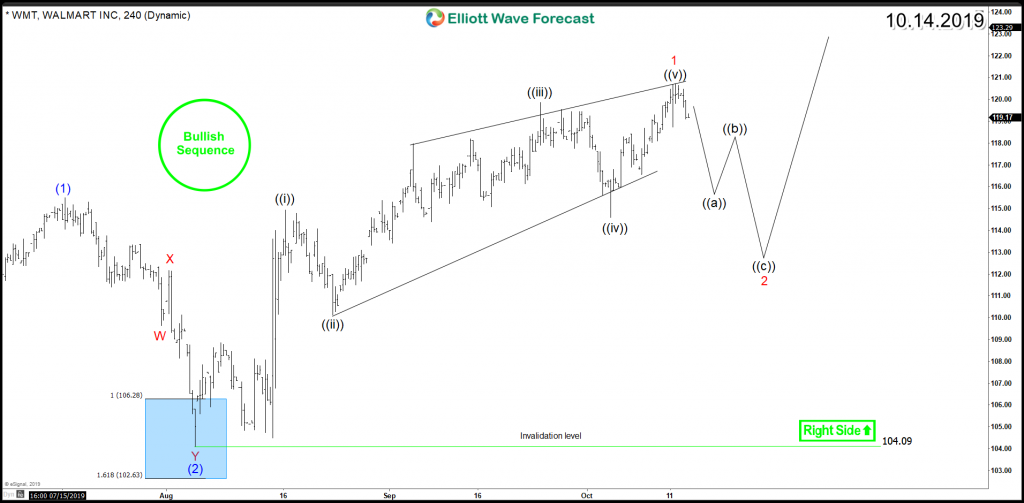
* Leading Diagonal that can produce a larger 3 waves pullback to correct the previous cycle and can reach the 50% - 61.8% Fibonacci retracement area $112 - $110 before buyers appear again to resume the bullish trend or at least bounce in 3 waves as long as $104 low is holding.
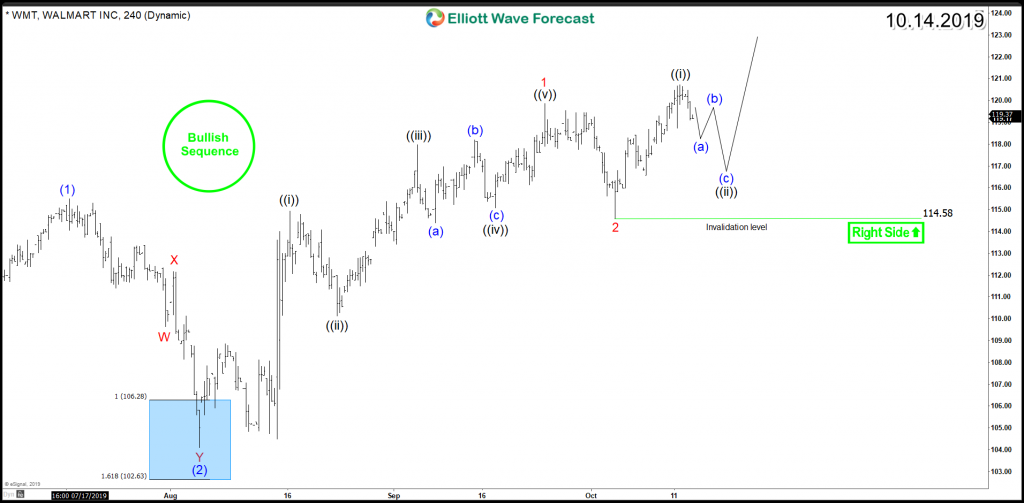
* Bullish nest taking place with a small connector already in place at 10/03 low $114.5 and therefore short term pullbacks will remain supported above that level for the stock to continue the rally higher.
In both scenarios, WMT will be a winner as the result of these impulsive structure taking place and consequently, traders can looking for buying opportunities in the short term pullbacks in 3 or 7 or 11 swings to join the bullish trend.
WMT 4H Chart (Diagonal)
(Click on image to enlarge)
WMT 4H Chart (Nest)
(Click on image to enlarge)



Comments
Log in or sign up to join the conversation.