
July's return for the S&P 500 Index of 5.64% pushed the index into positive territory for the year, returning 2.38% year to date. More impressive is the S&P 500's return since the March 23 low at +46.2%. It is hard not to agree there appears to be an upward bid to the equity market in spite of concerns around the virus-induced weakness in some of the economic data; especially in the jobs/employment data.
In my last post, I wrote about the AAII Sentiment Survey and concluded the market seems to be climbing a wall of worry, given the low level of bullishness being expressed by individual investors.
It is noteworthy, from a calendar perspective, that the November election is beginning to factor into other sentiment measures like the VIX, and more specifically, the three-month Volatility Index (VXV). Just like most investor sentiment measures, the significance of the readings works best at their extreme.
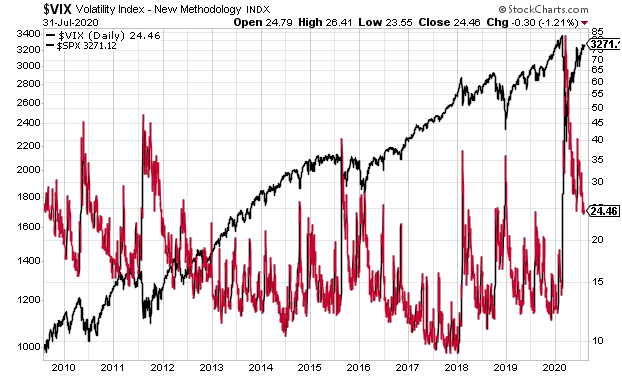
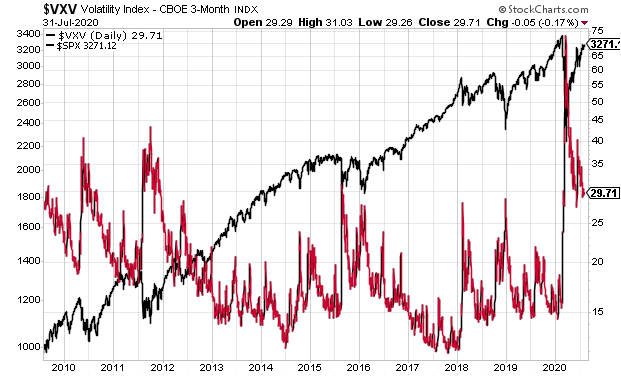
In the case of the VIX and VXV, it tends to be easier to gauge market bottoms with high VIX values, rather than market tops with low VIX levels. As can be seen in the below charts, both the VIX and VXV spike at times of market fear. With the three-month Volatility Index, VXV, at a higher level, the option market is expecting higher volatility three months out, versus over the next month (VIX). This is referred to as the VIX curve being in contango.
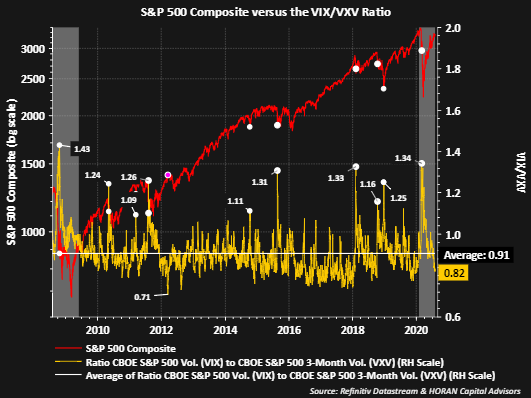
A better way to look at the VIX term structure is by comparing the VIX and VXV together. A common way to look at these two risk measures is to evaluate the ratio over time. The below chart shows when the ratio of VIX to VXV is greater than 1.1, or in other words, is experiencing backwardation: the equity market (S&P 500 Index) is at or near an intermediate low.
The average for the ratio on the chart is .91, and the ratio spends most of its time at levels below 1.0. Clearly, it seems more difficult to predict market tops with lower ratio levels since the ratio spends most of its time at levels below 1.0. Other writers have noted market tops tend to occur at ratio levels below .75.
It can be insightful to evaluate the absolute difference between VIX and VXV, versus simply looking at the ratio. Currently, the spread is a wide negative 5.25%, which indicates option market pricing is factoring in higher volatility three months from now (VXV) versus over the next 30 days (VIX).
It is worth noting that this wide of a spread has occurred near intermediate market tops. And, of course, this higher future volatility coincides with the upcoming U.S. election.

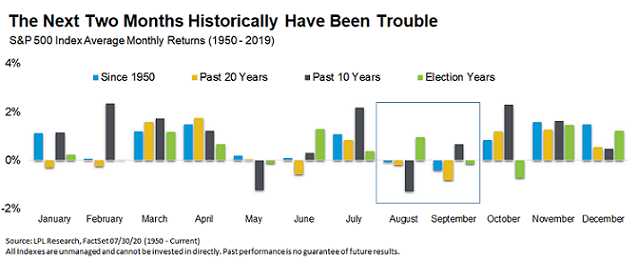
Finally, the market is in the calendar period where seasonal weakness tends to be most prevalent, i.e. in August and September. Ryan Detrick, CMT, and Chief Market Strategist with LPL Financial, highlights this with the below chart. In an election year, though, August has been a positive returning month for the S&P 500 Index.
In conclusion, on an absolute basis, the VIX and VXV remain elevated and are trending lower, which is generally favorable for stocks.
However, when evaluating the two variables as a ratio or their absolute difference, market caution might be warranted. With the ratio at .82, historically, the S&P 500 has a pretty strong positive track record, as it appears a level below .75 is a better indication of a potential market top.


Comments
Log in or sign up to join the conversation.